Behind the Graphs
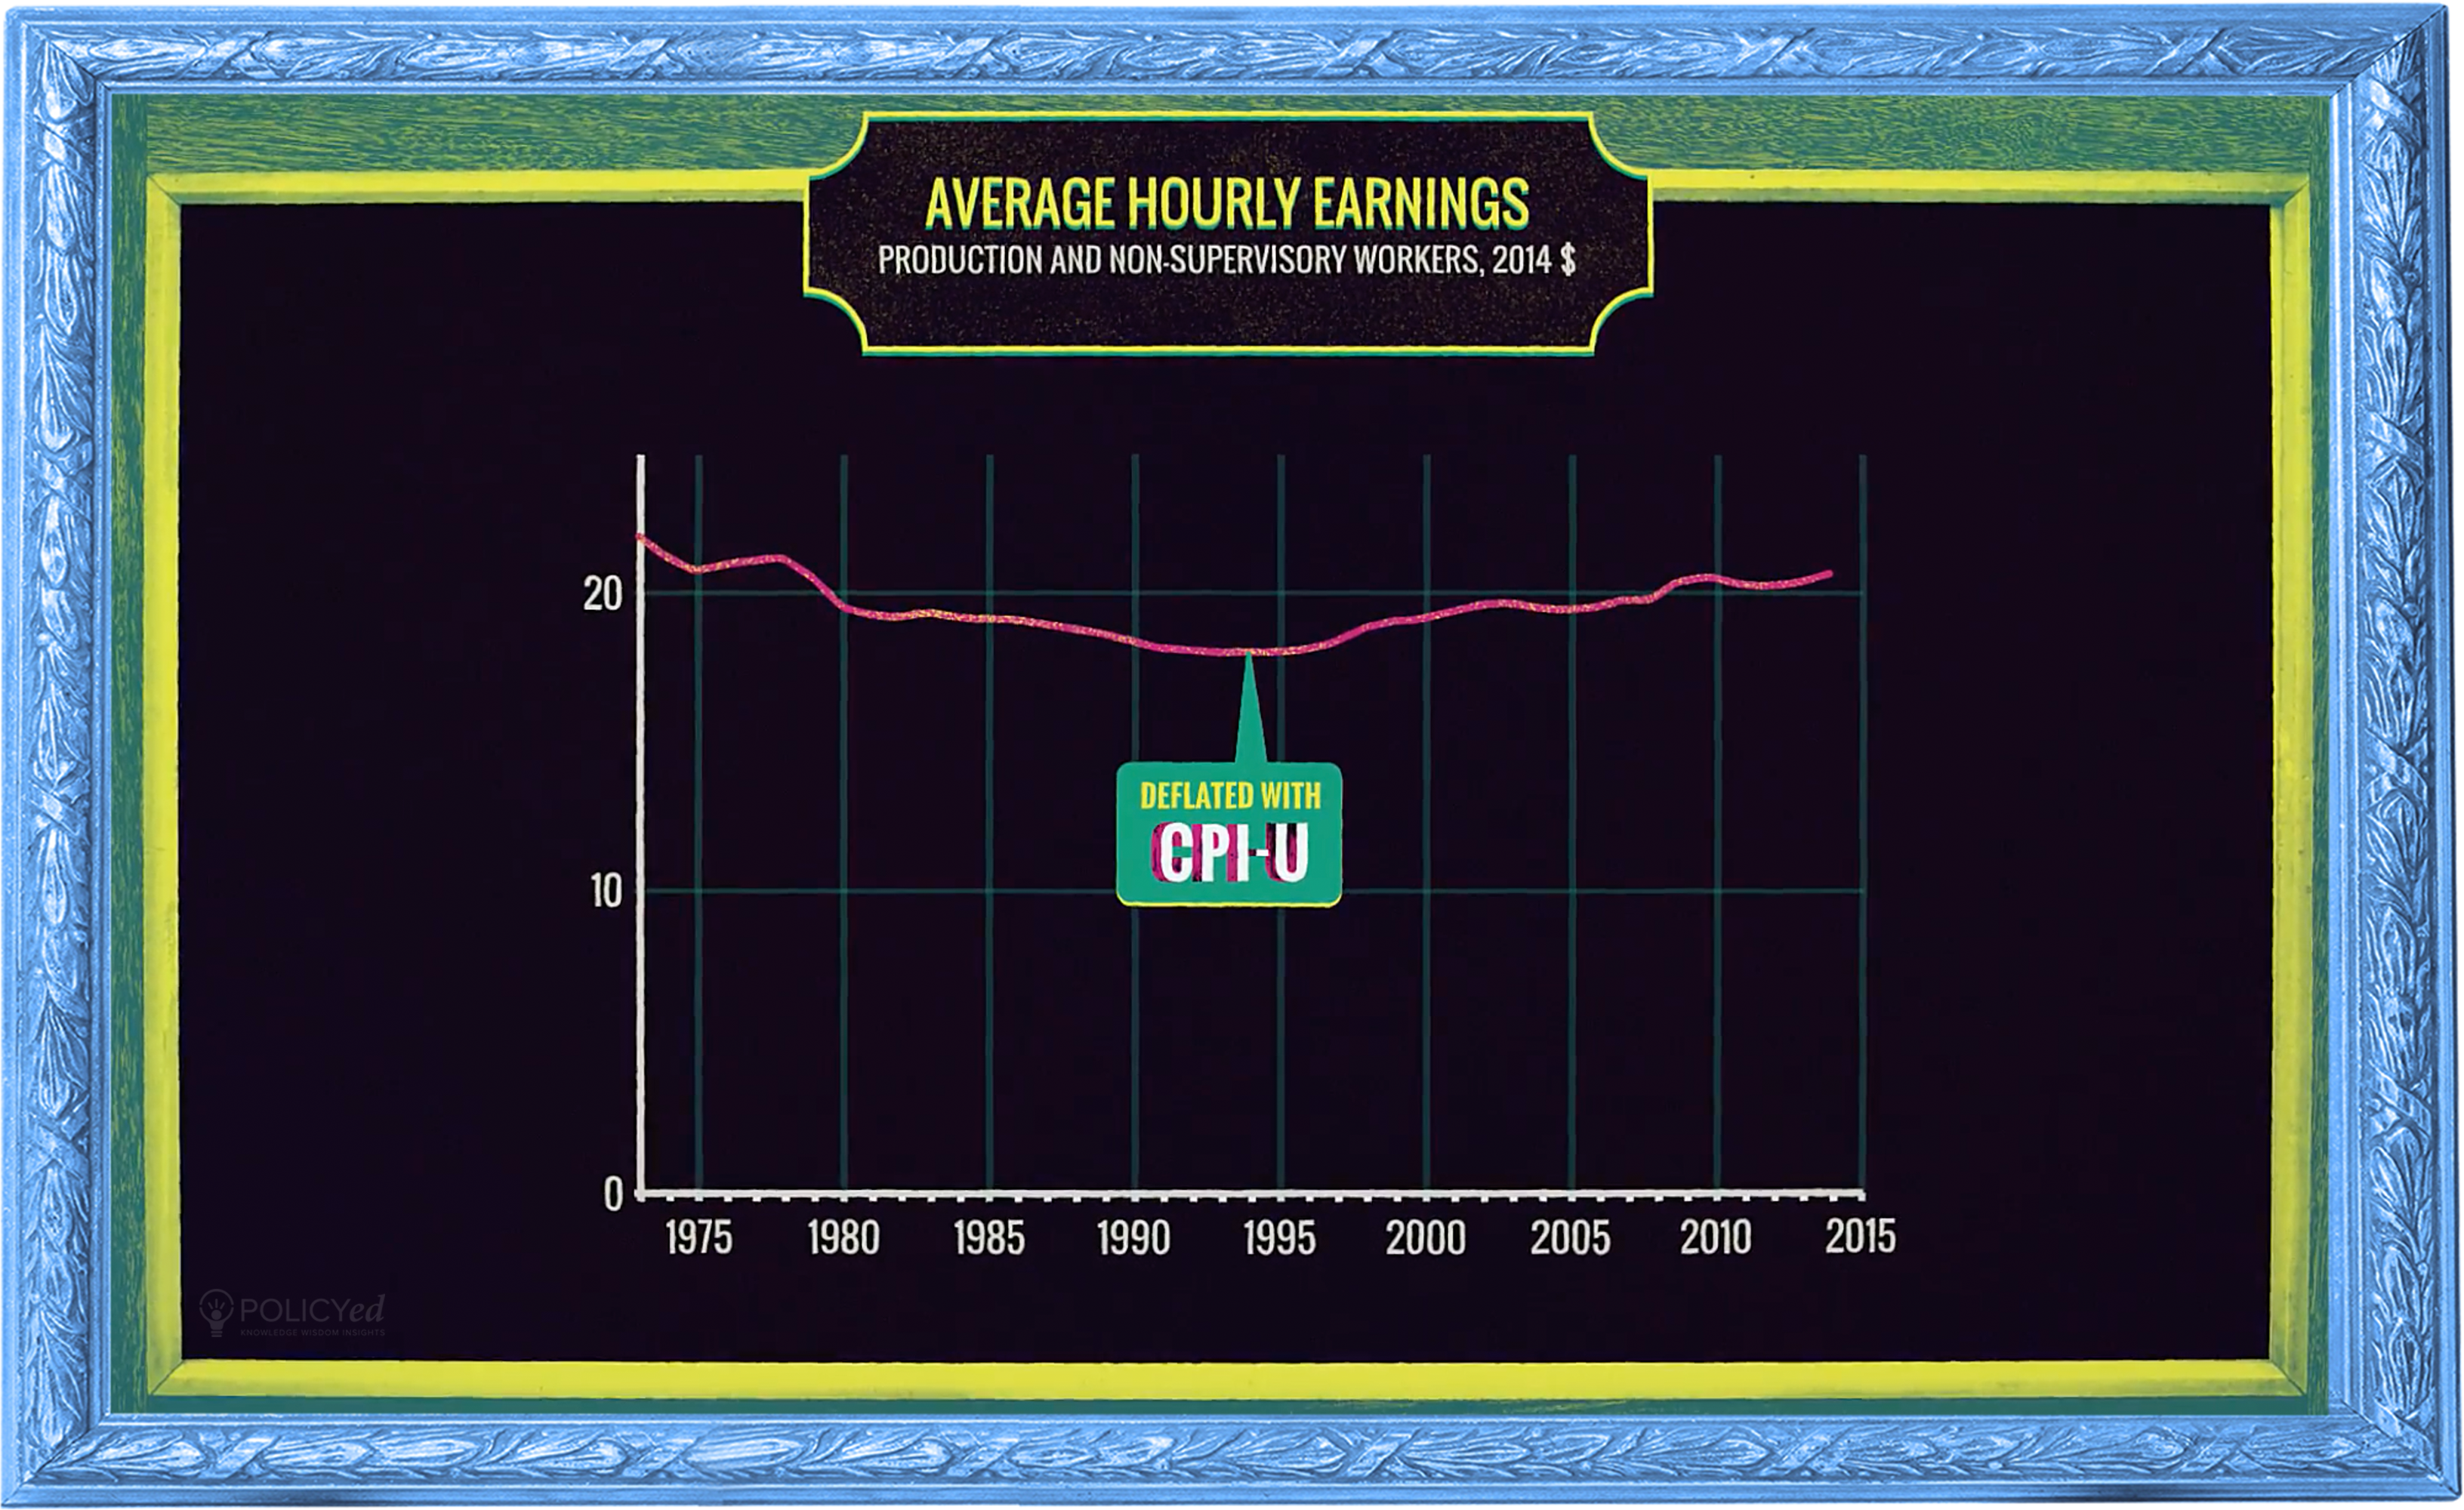
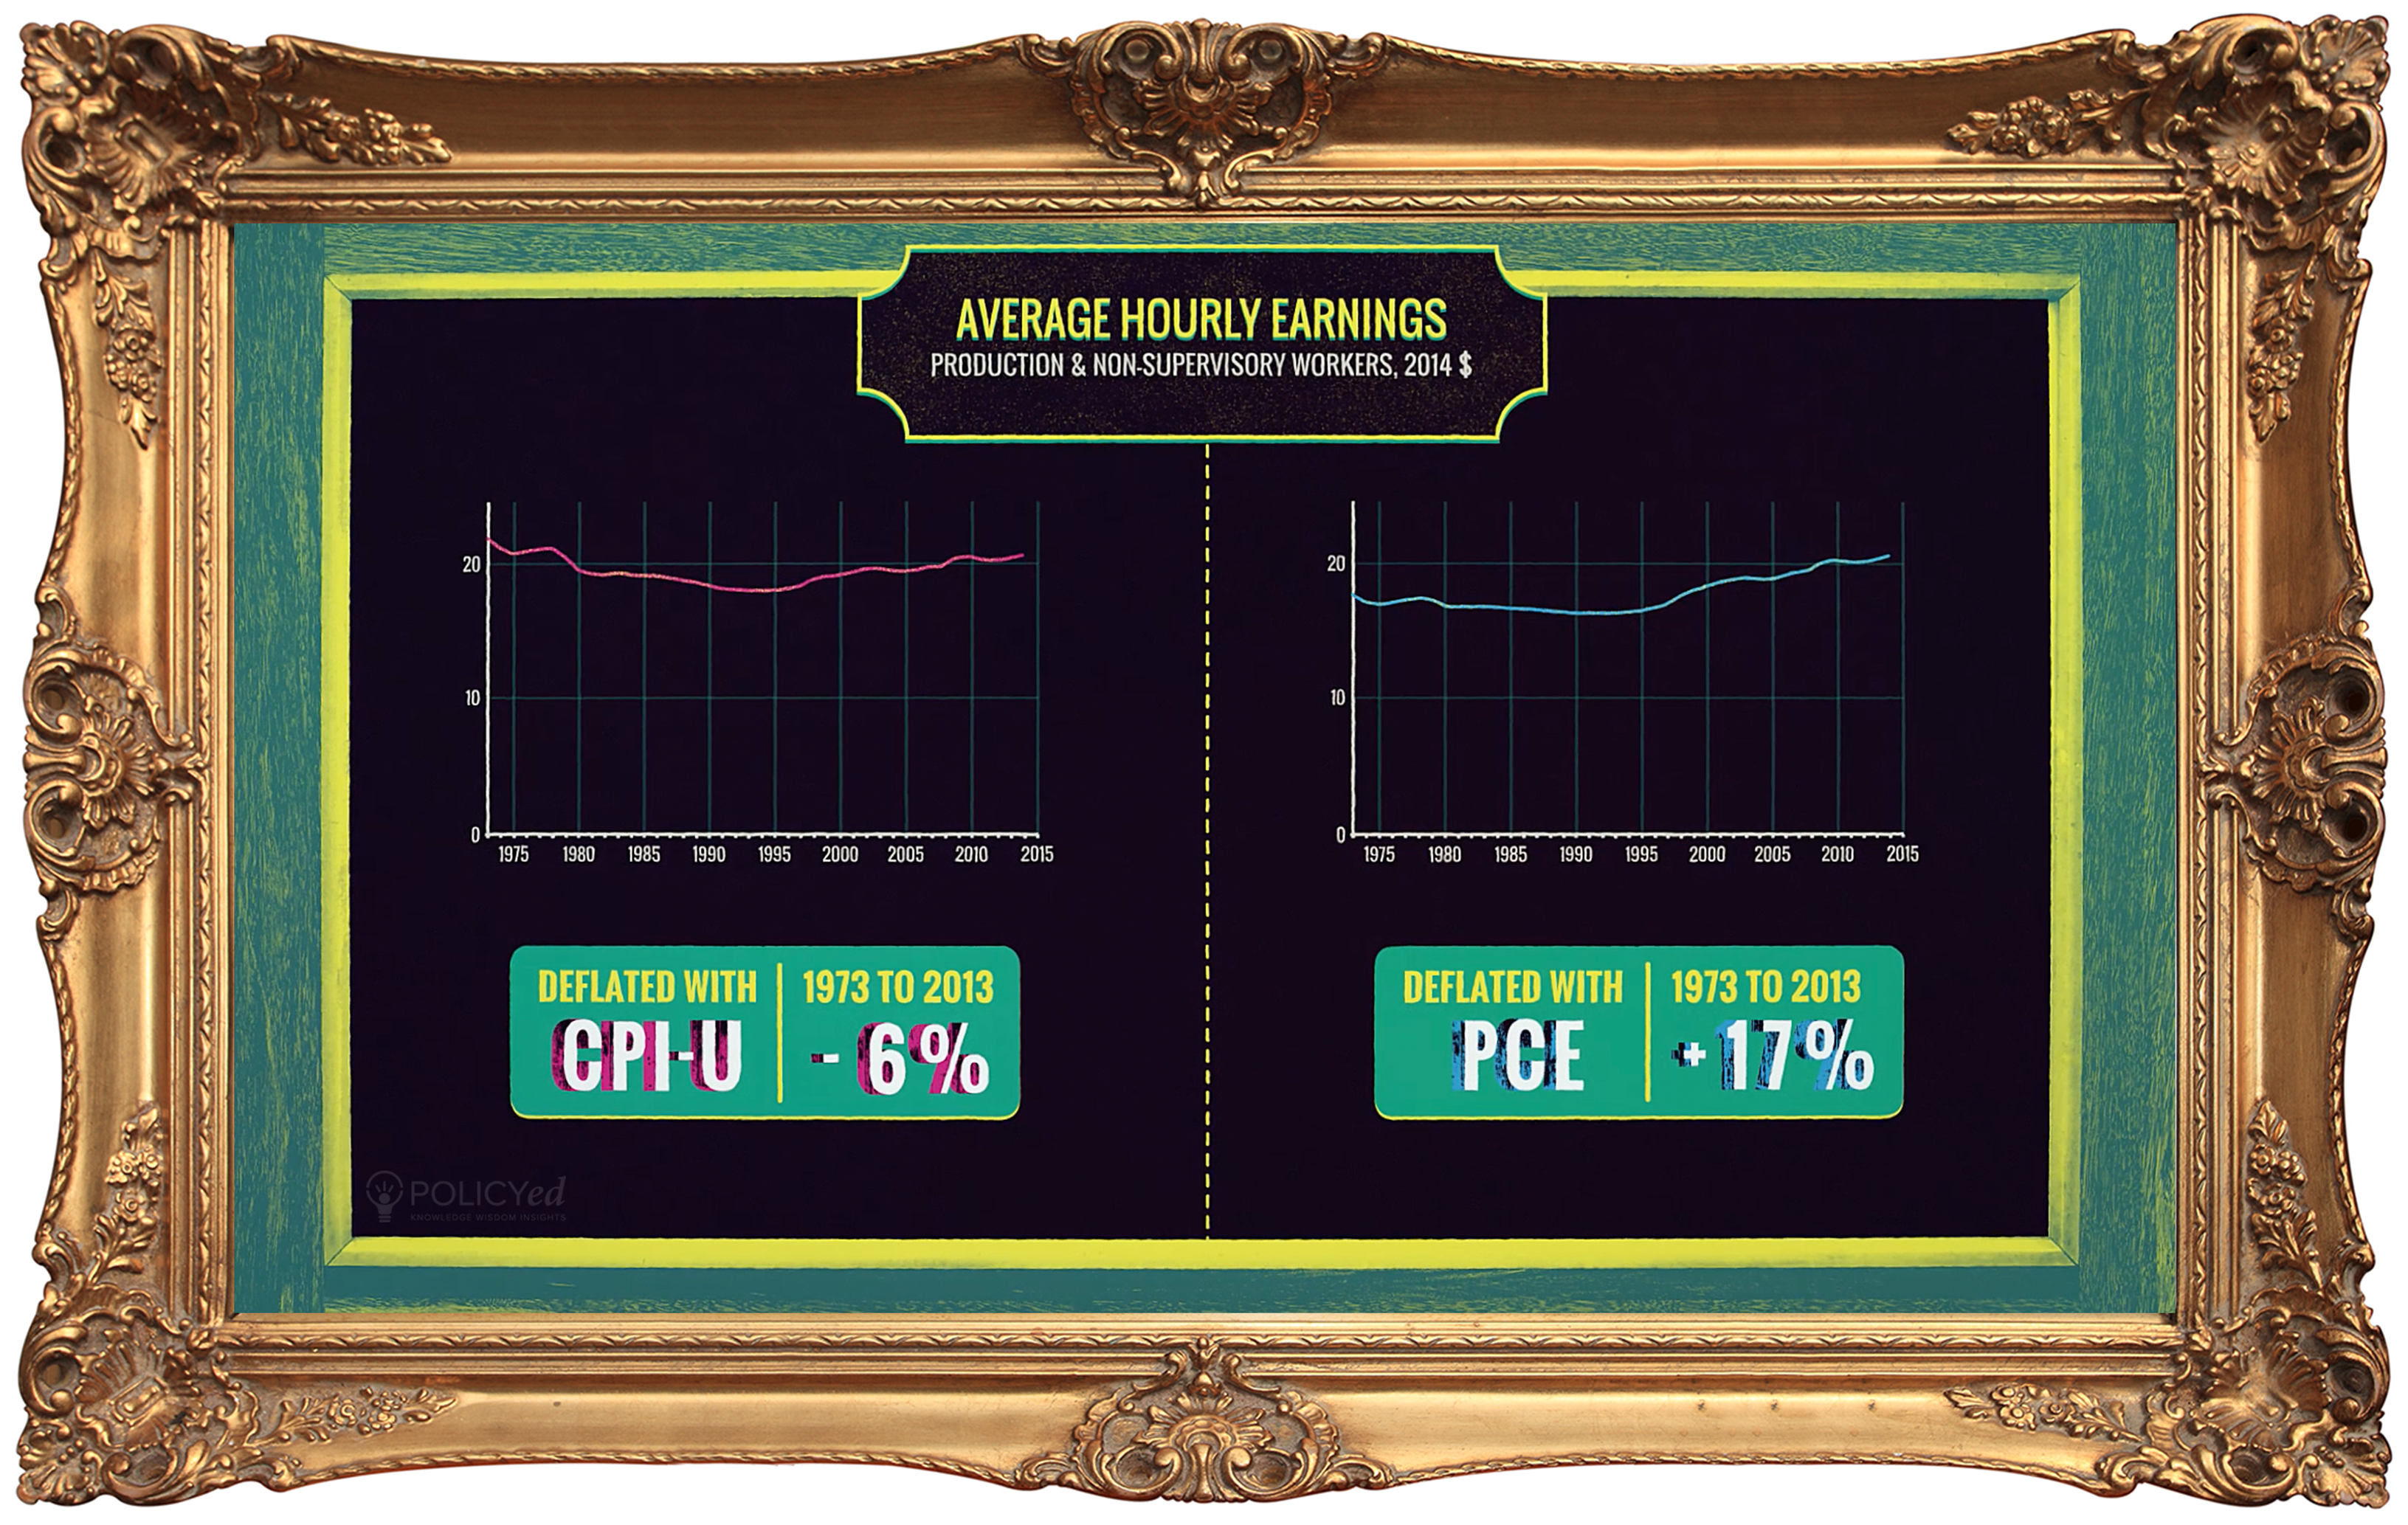
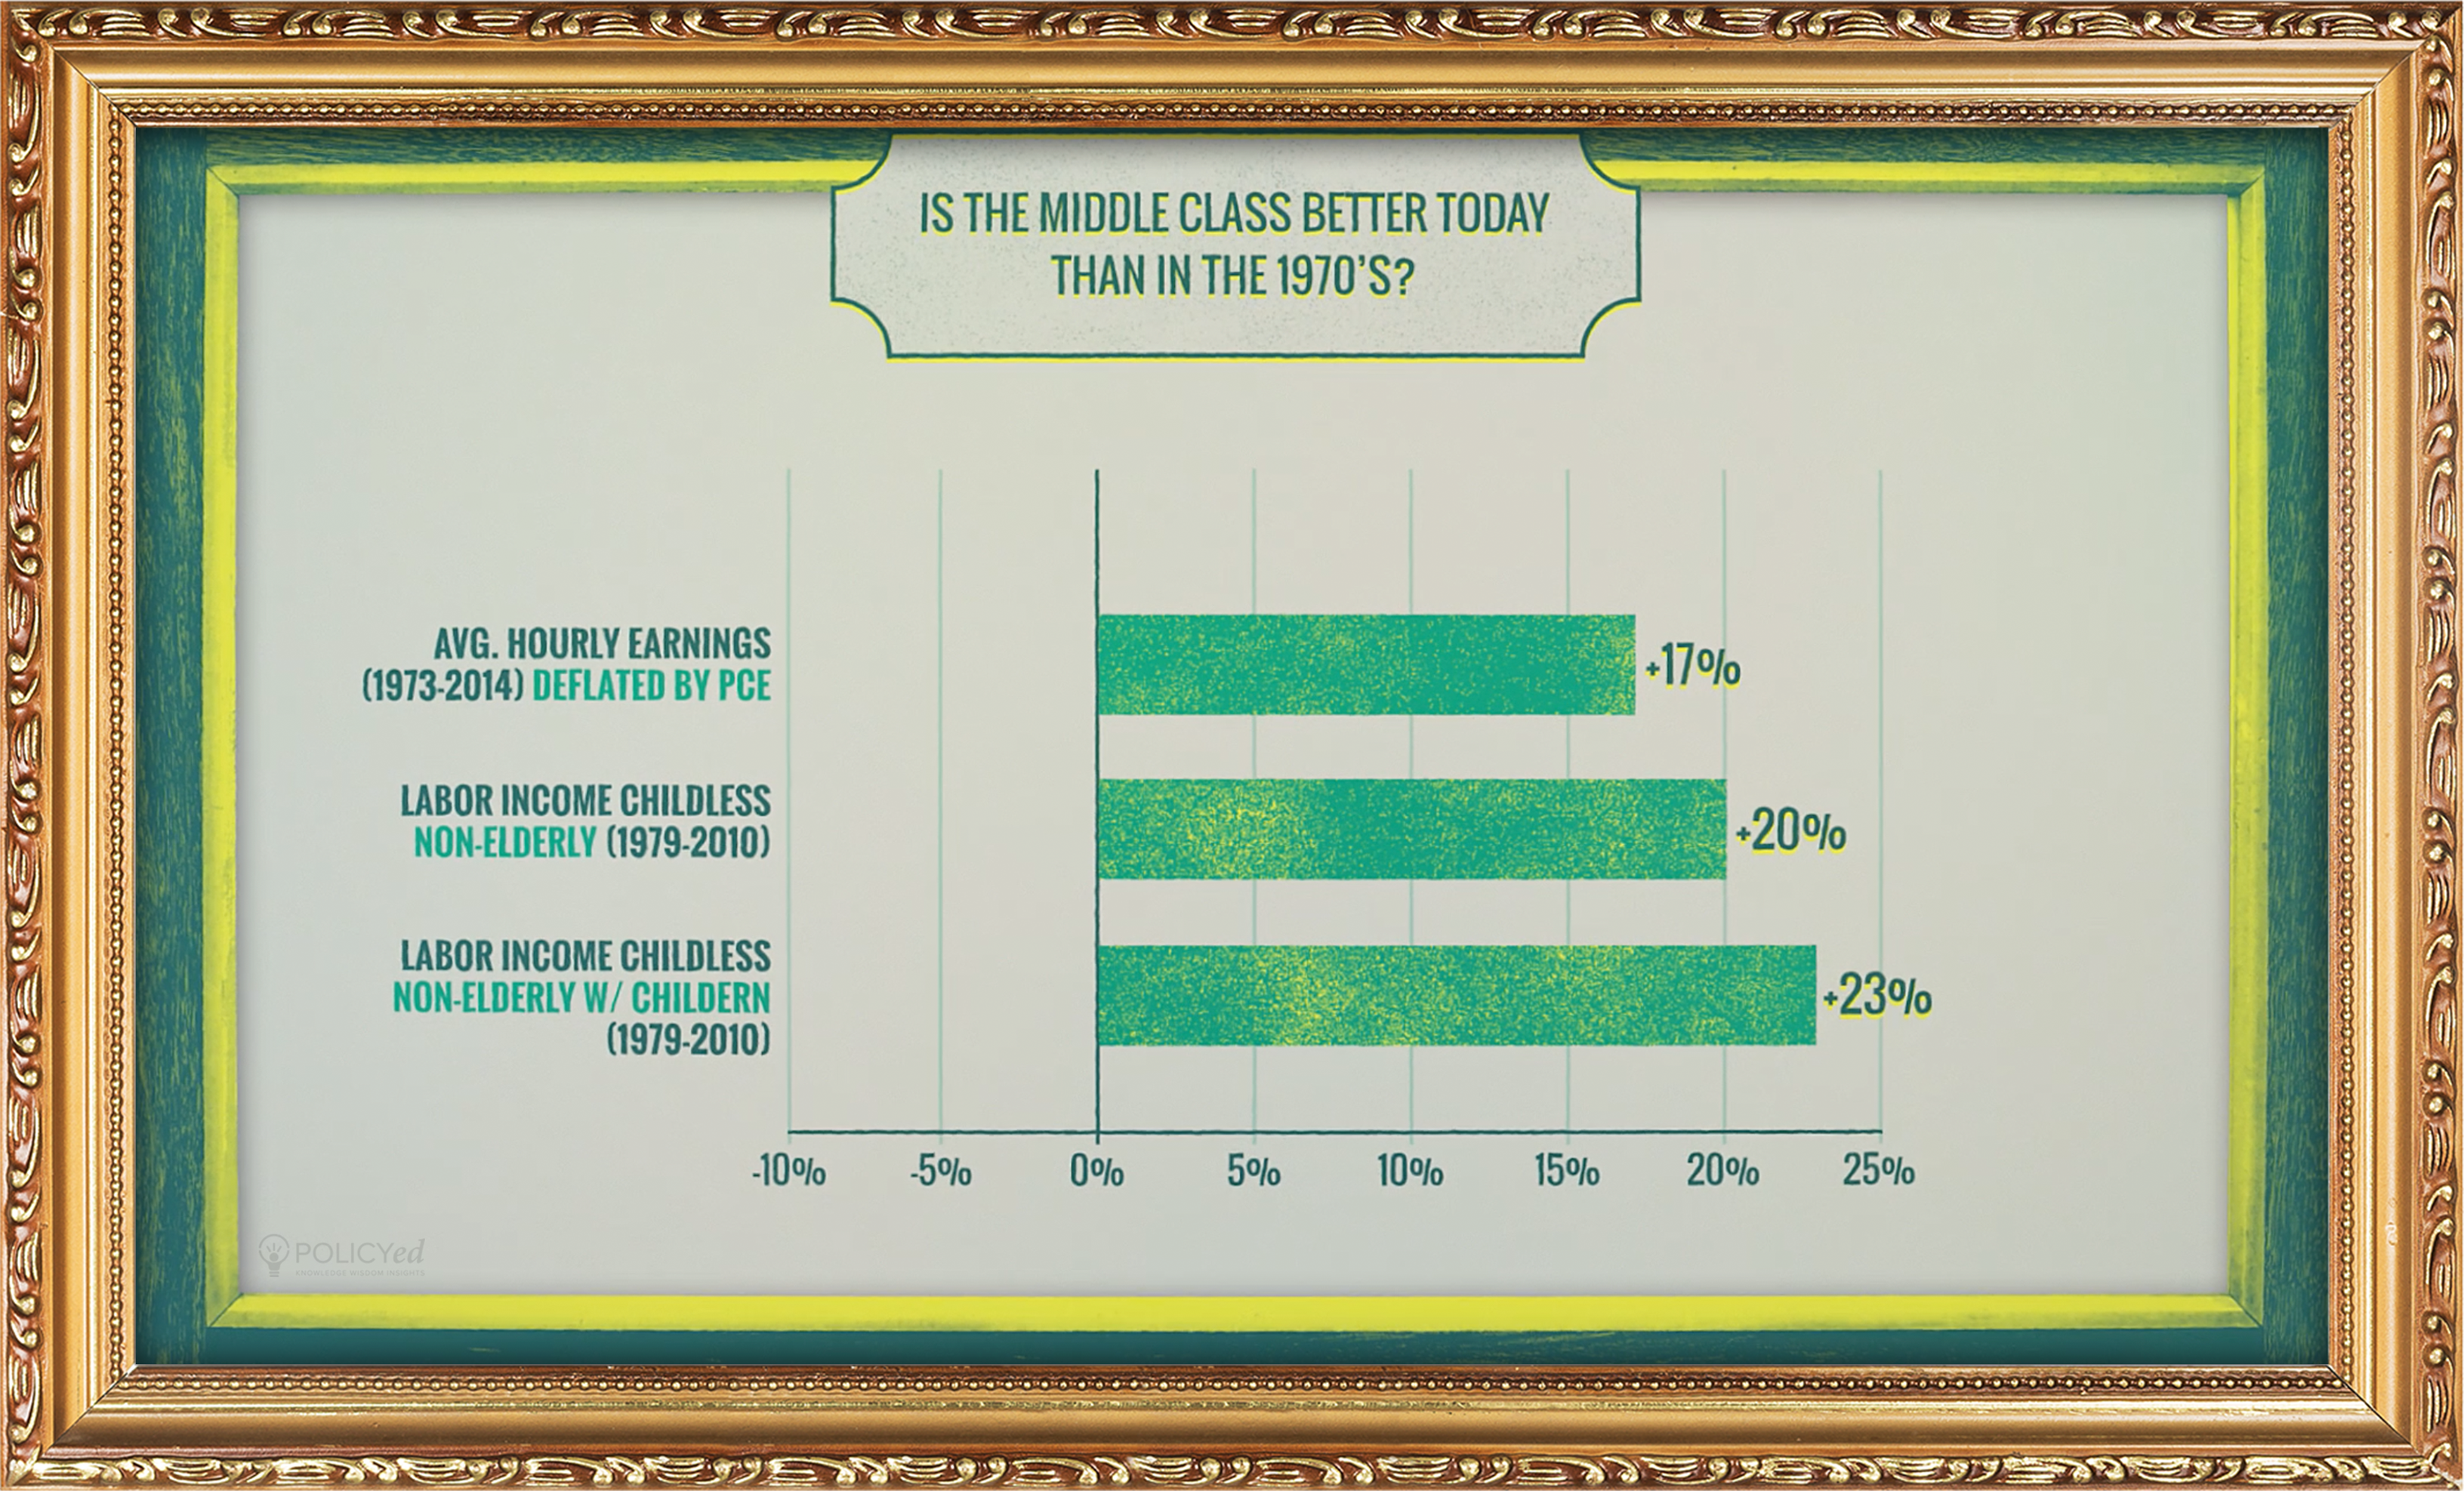
If you adjust the average hourly earnings of production and non-supervisory workers from 1973 to 2014 using the Personal Consumption Expenditures (PCE) index, personal incomes increased by 17%. The PCE measures prices differently than the CPI-U—the measure of inflation used in the previous chart.
It includes both urban and rural consumers, measures health care and changes in housing prices differently, and is a chained index, allowing for substitution away from goods that become relatively more expensive.
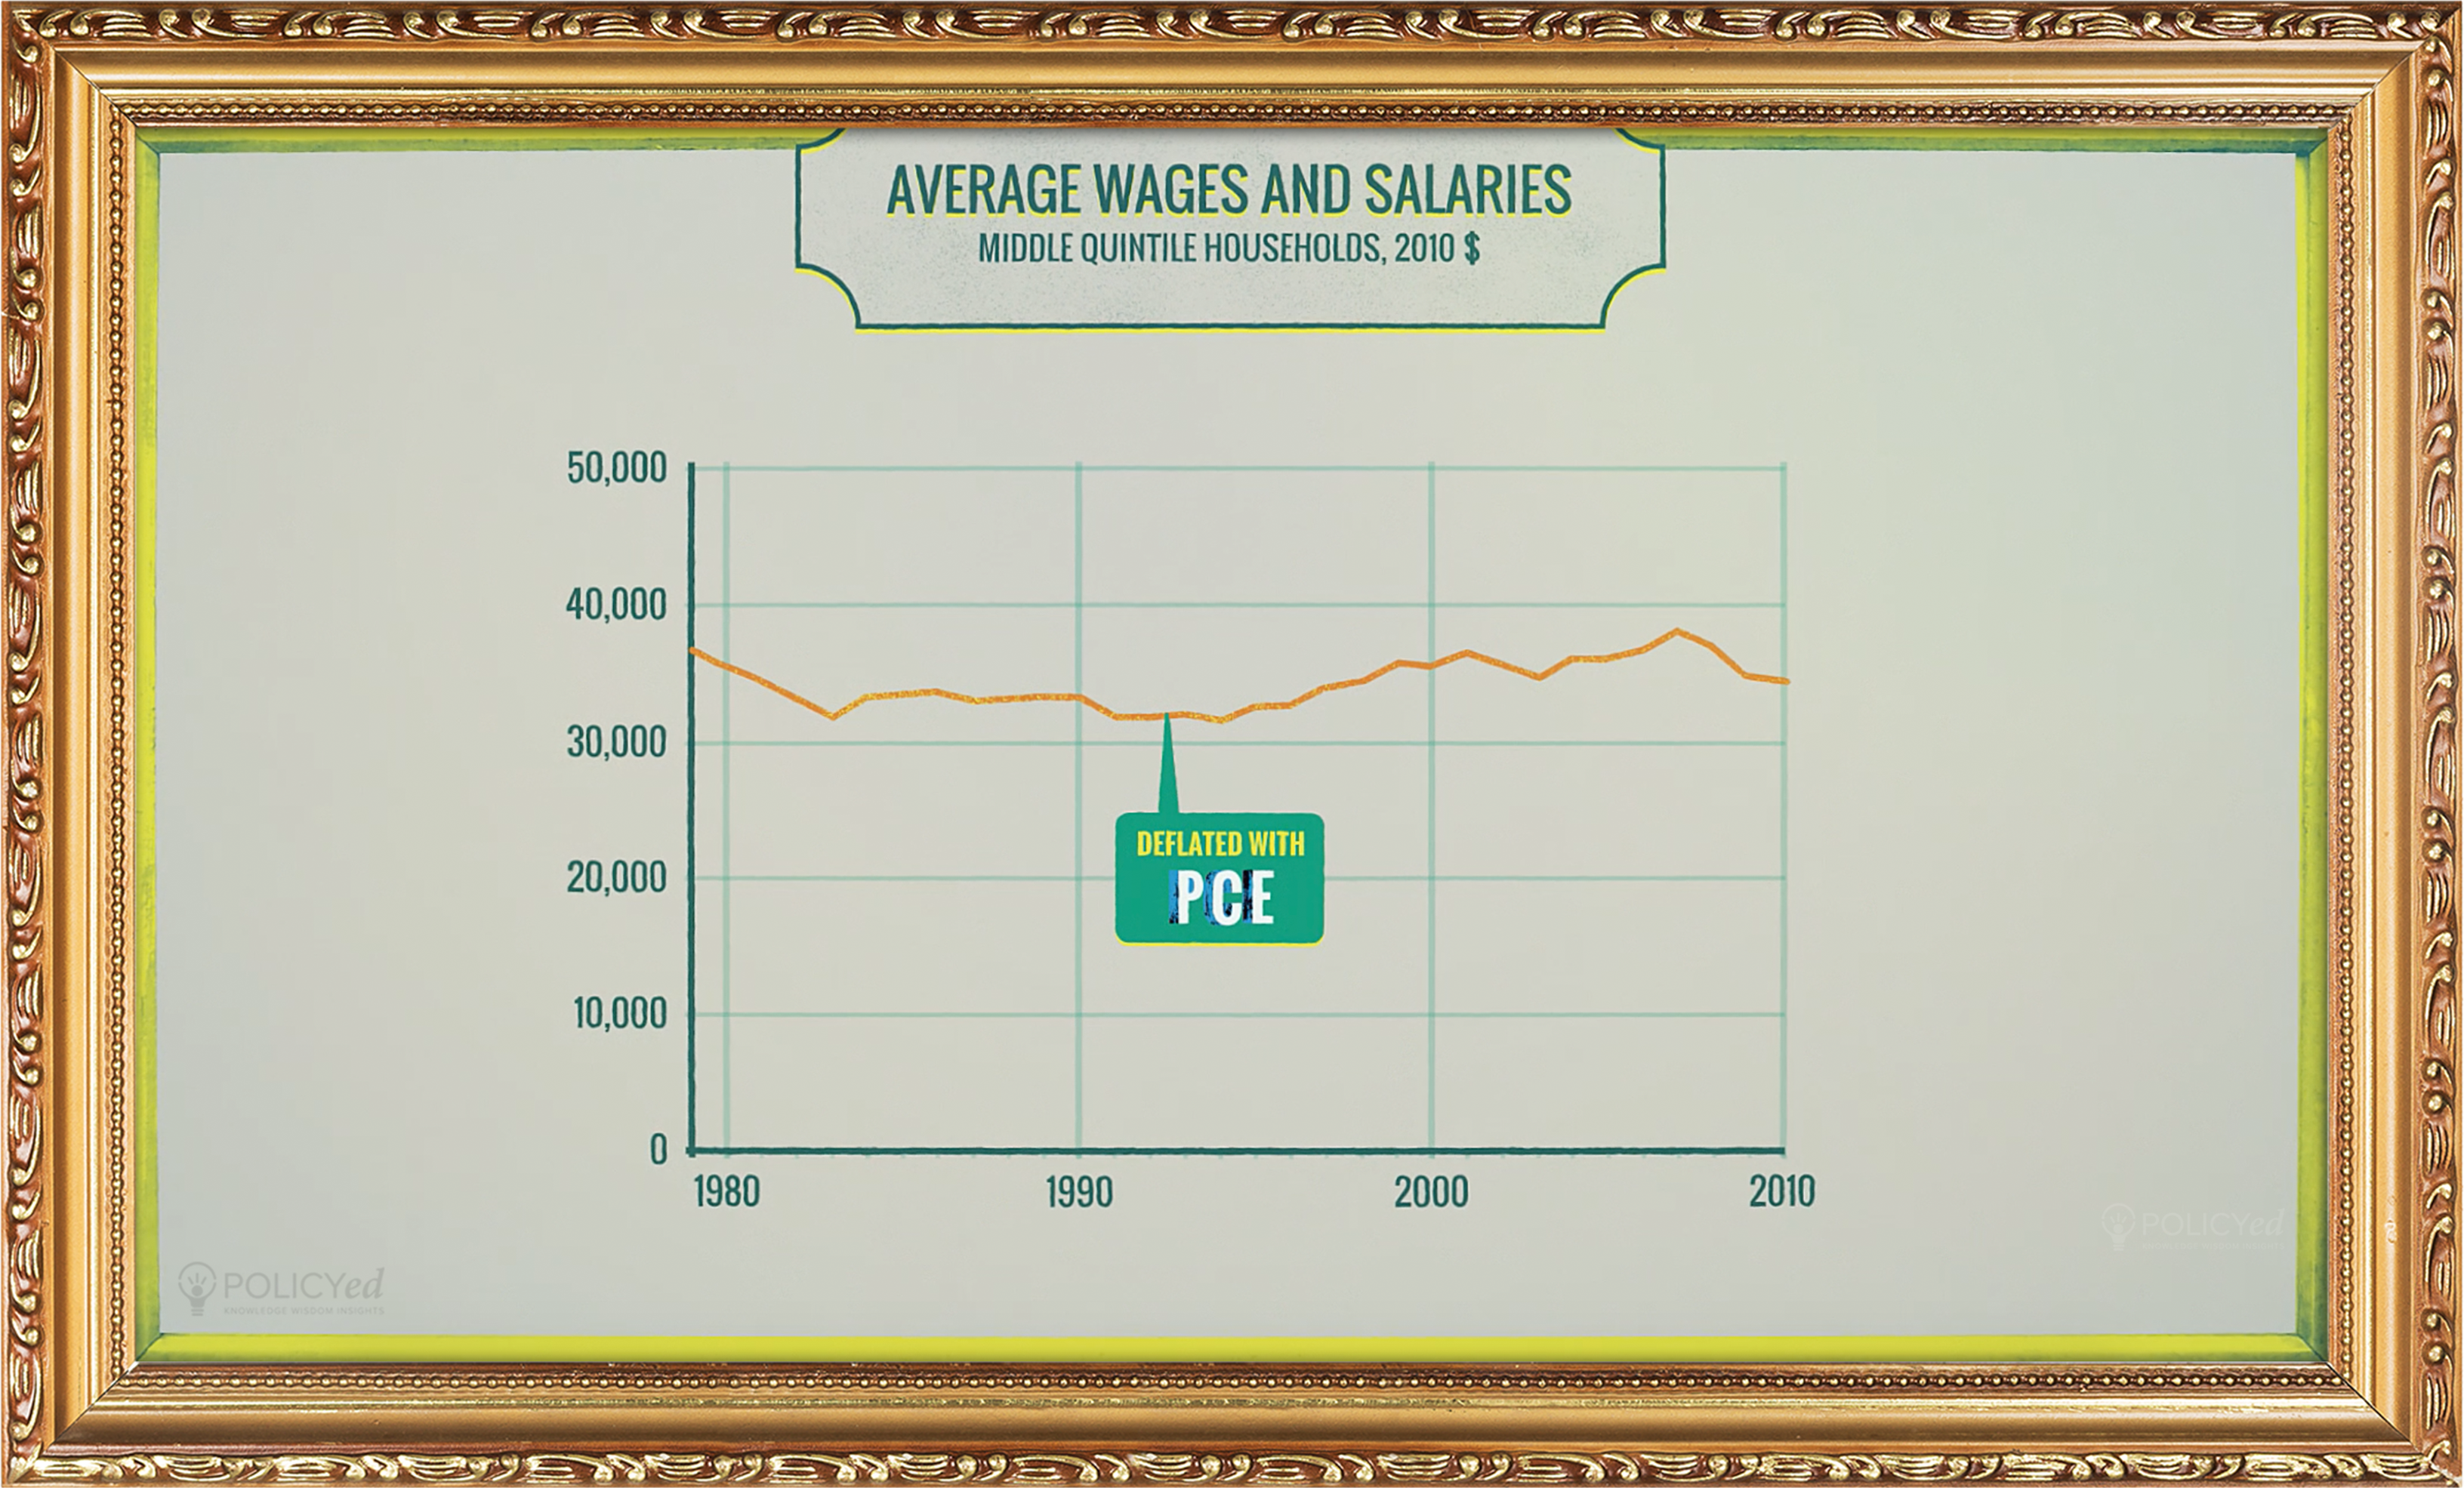
The previous charts were average hourly earnings for individuals. This chart uses a broader measure of earnings and looks at households. To avoid the problem of the super-rich pulling up the average in a way that fails to capture how the middle class is doing, it looks at the average in the middle quintile. Even adjusting the numbers with the PCE, from 1979 to 2010, incomes decline by 7%. Ugly.
But the middle-income quintile households shown above include older families who may be working part-time. Households with older, retired people are growing as a share of the population, their lower incomes will cause the measurement of the progress of the middle class to look lousy just because older households are becoming more numerous over time.
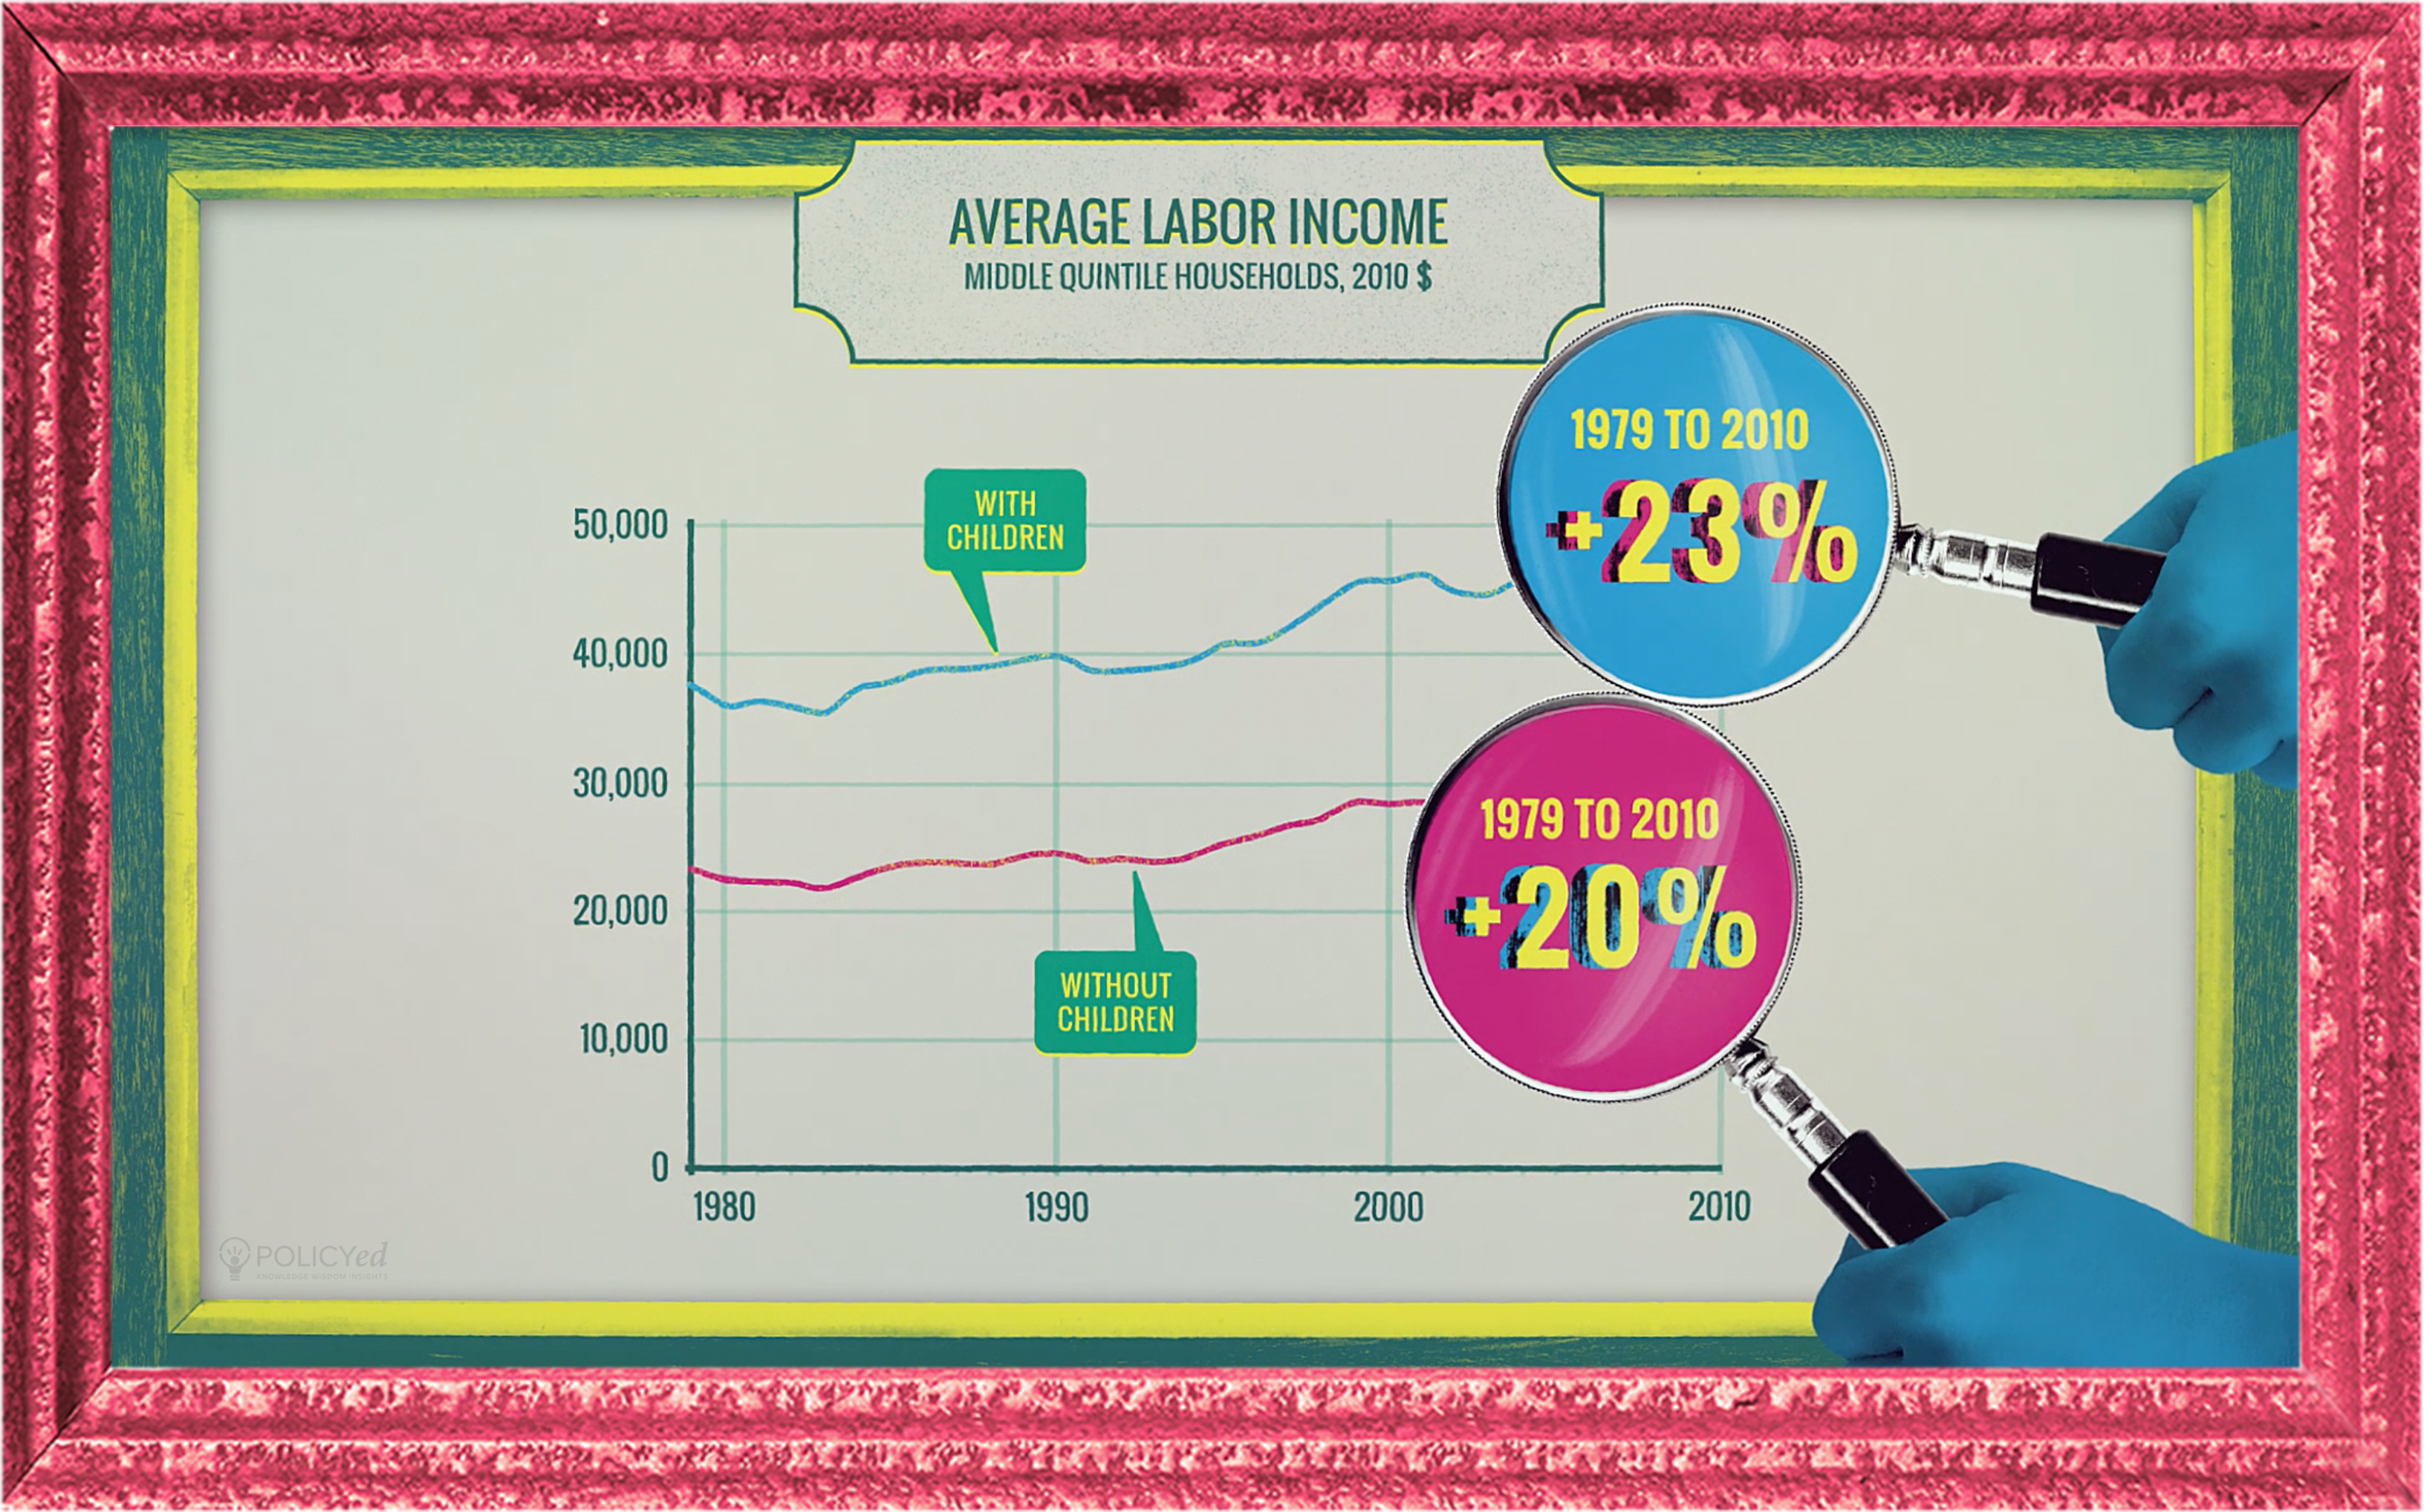
Scott Winship, now the director of the Social Capital Project at the Joint Economic Committee, used data from the Congressional Budget Office to look at two sub-populations that are more representative of the working middle class: households with children and non-elderly households without children. These sub-groups exclude most or all retirees and should allow for a more accurate measure of how the economy is treating the middle class.
He also uses labor income, which includes non-cash benefits that have become a larger share of every working American’s compensation.
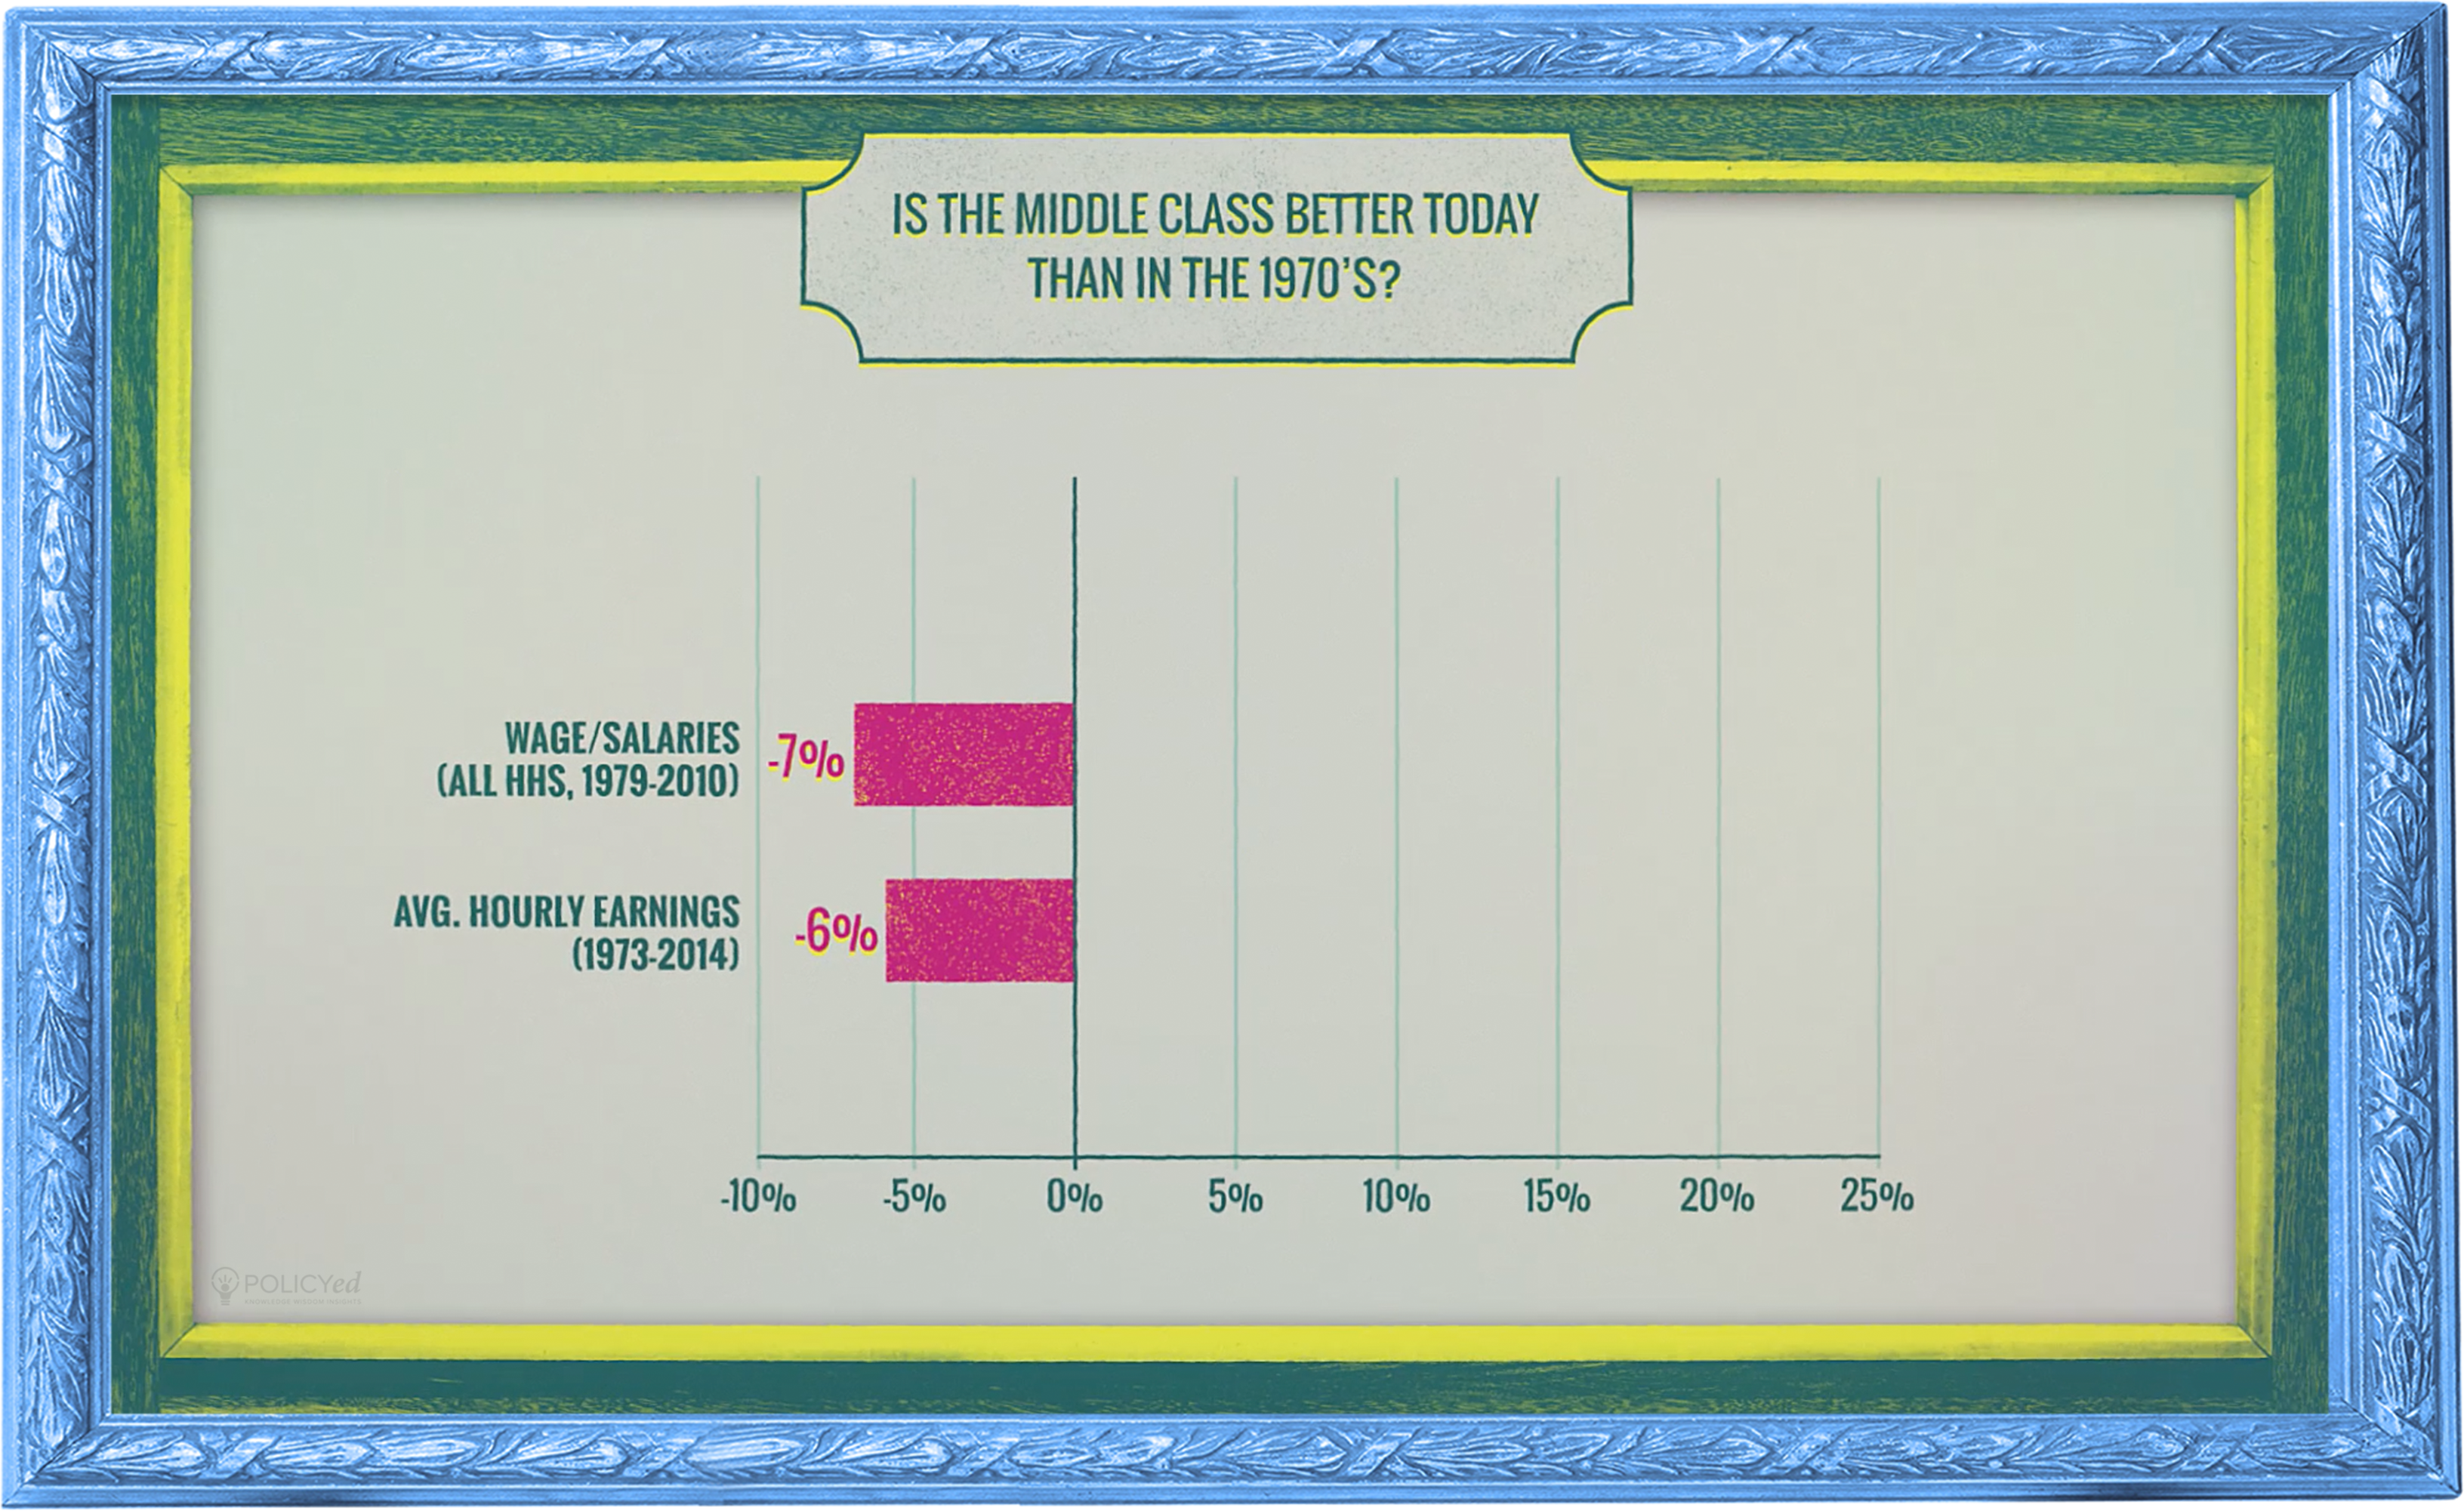
If progress is measured by including retired families or using a price index that typically shows higher inflation, then growth is actually negative.
What’s the right number?
The truth turns out to be complicated. Tune in to the next installment of The Numbers Game, “The Paradox of Household Income."