Behind the Data
GDP Per Capita
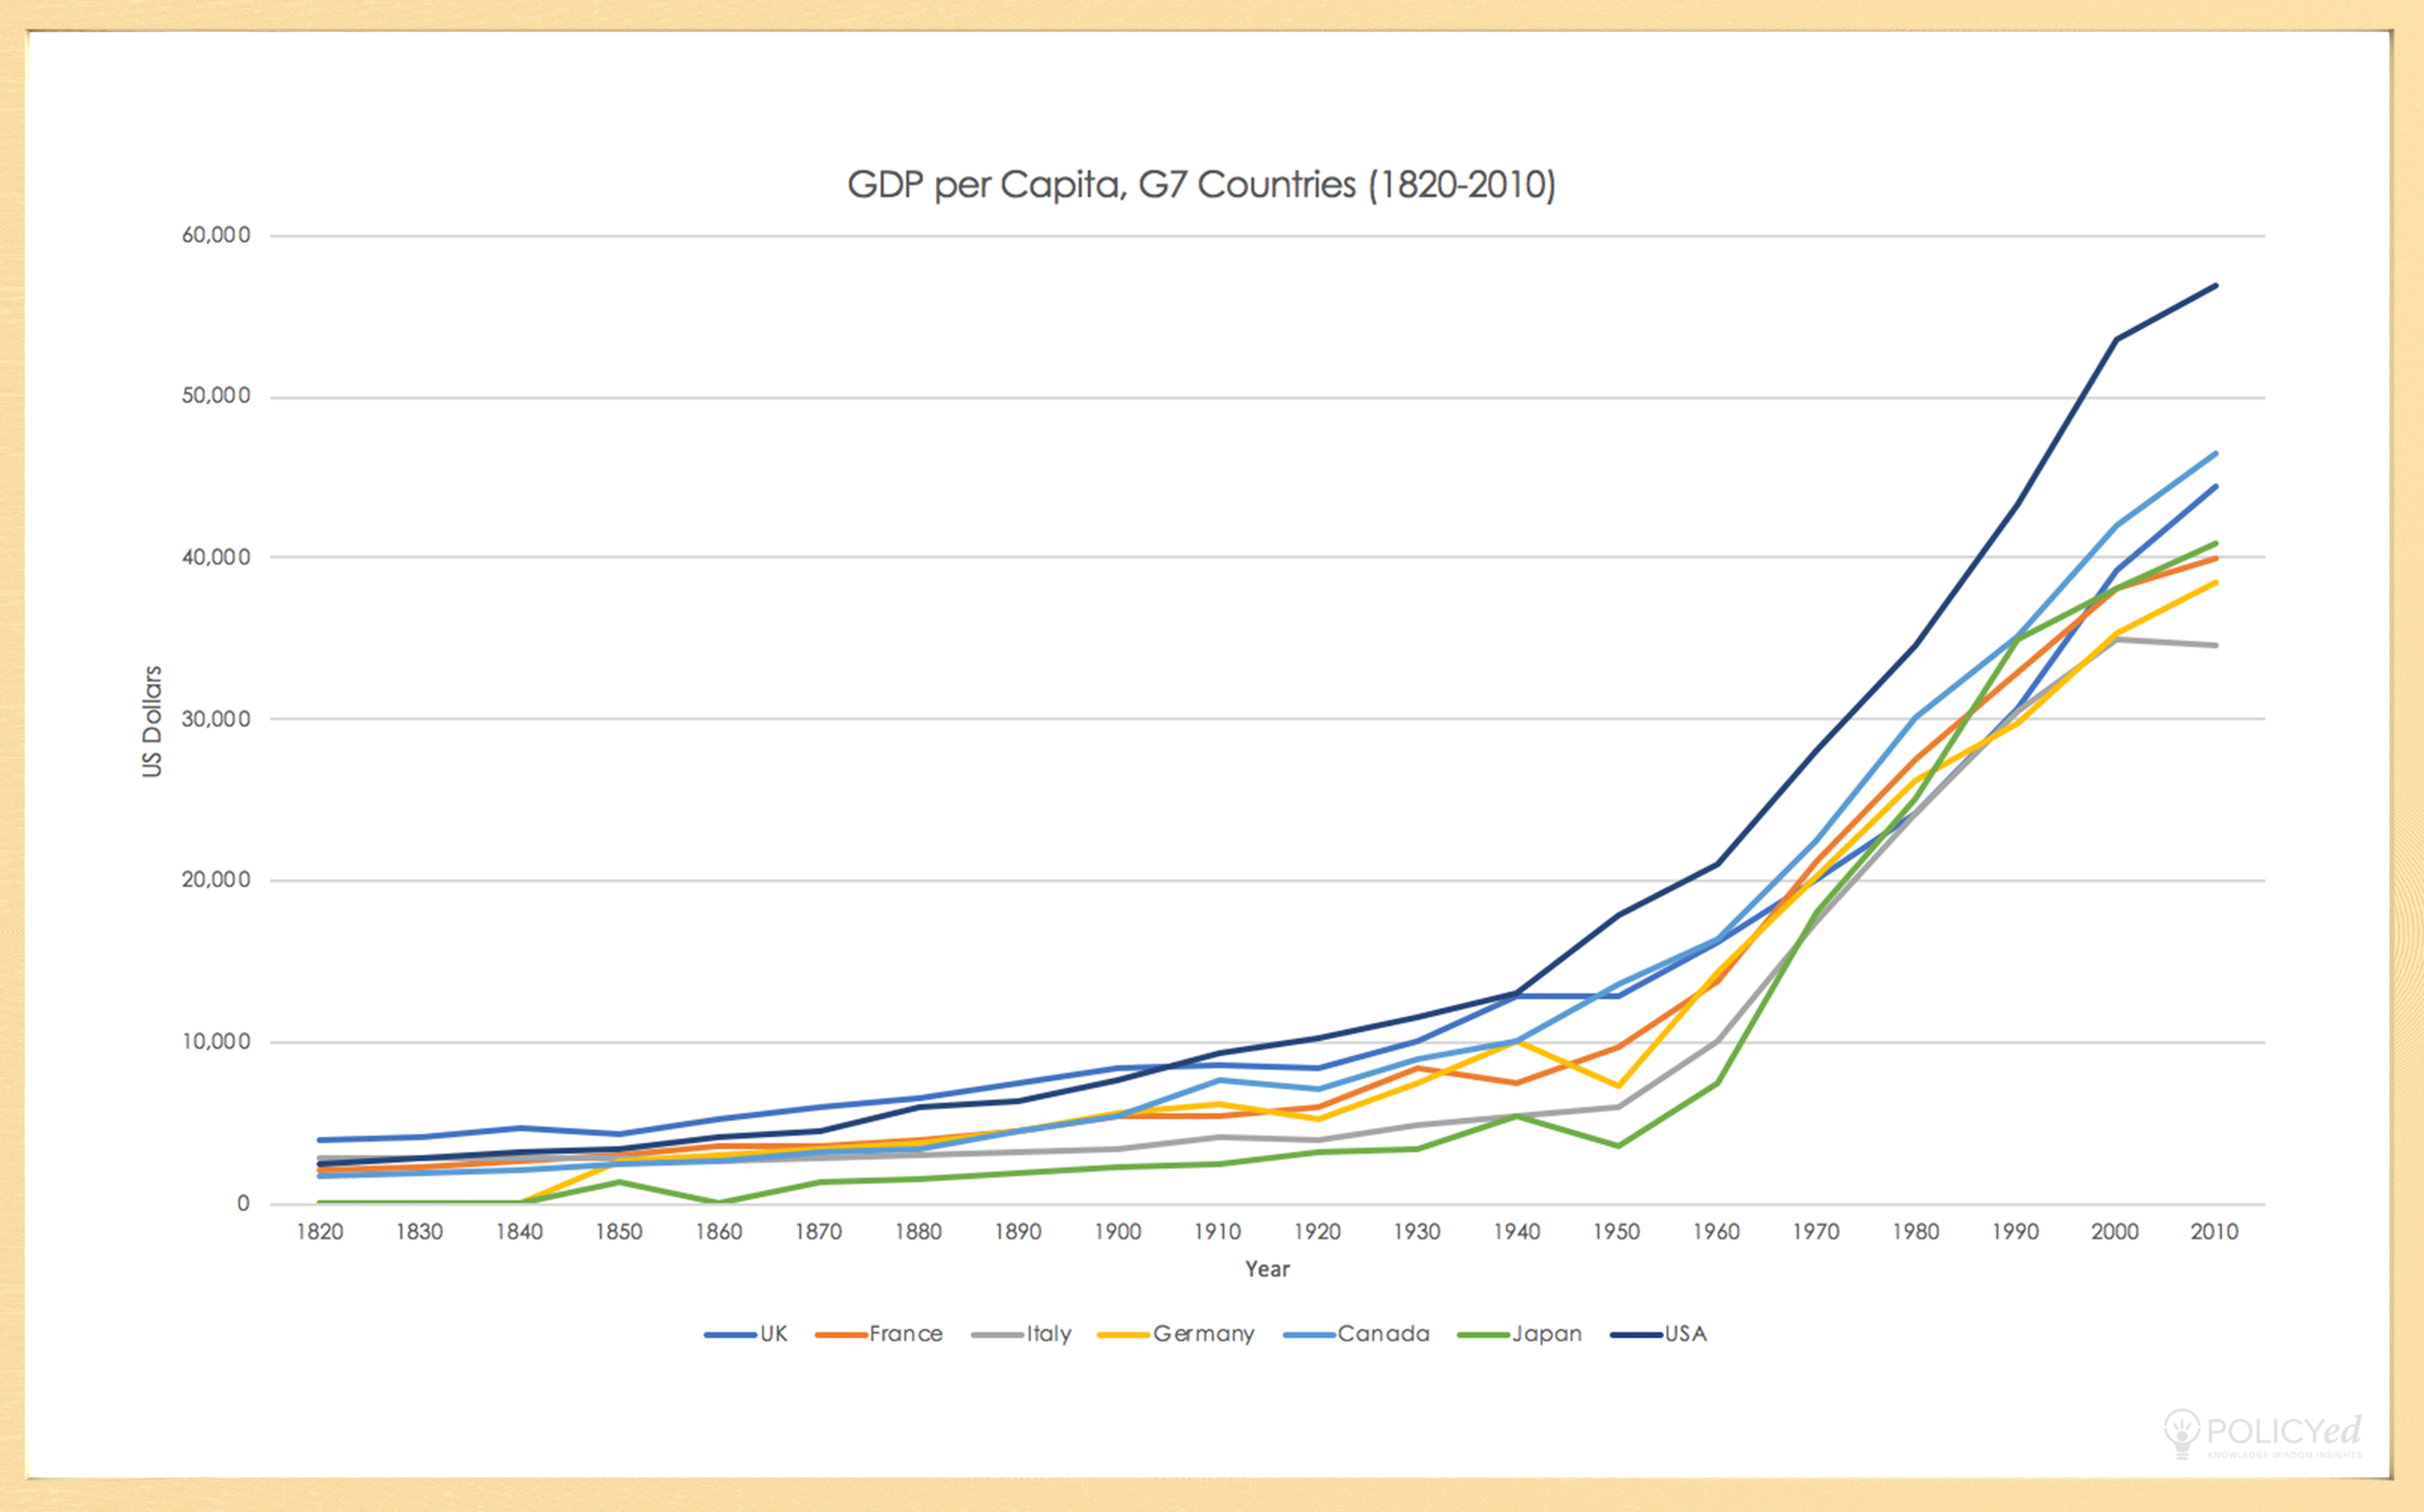
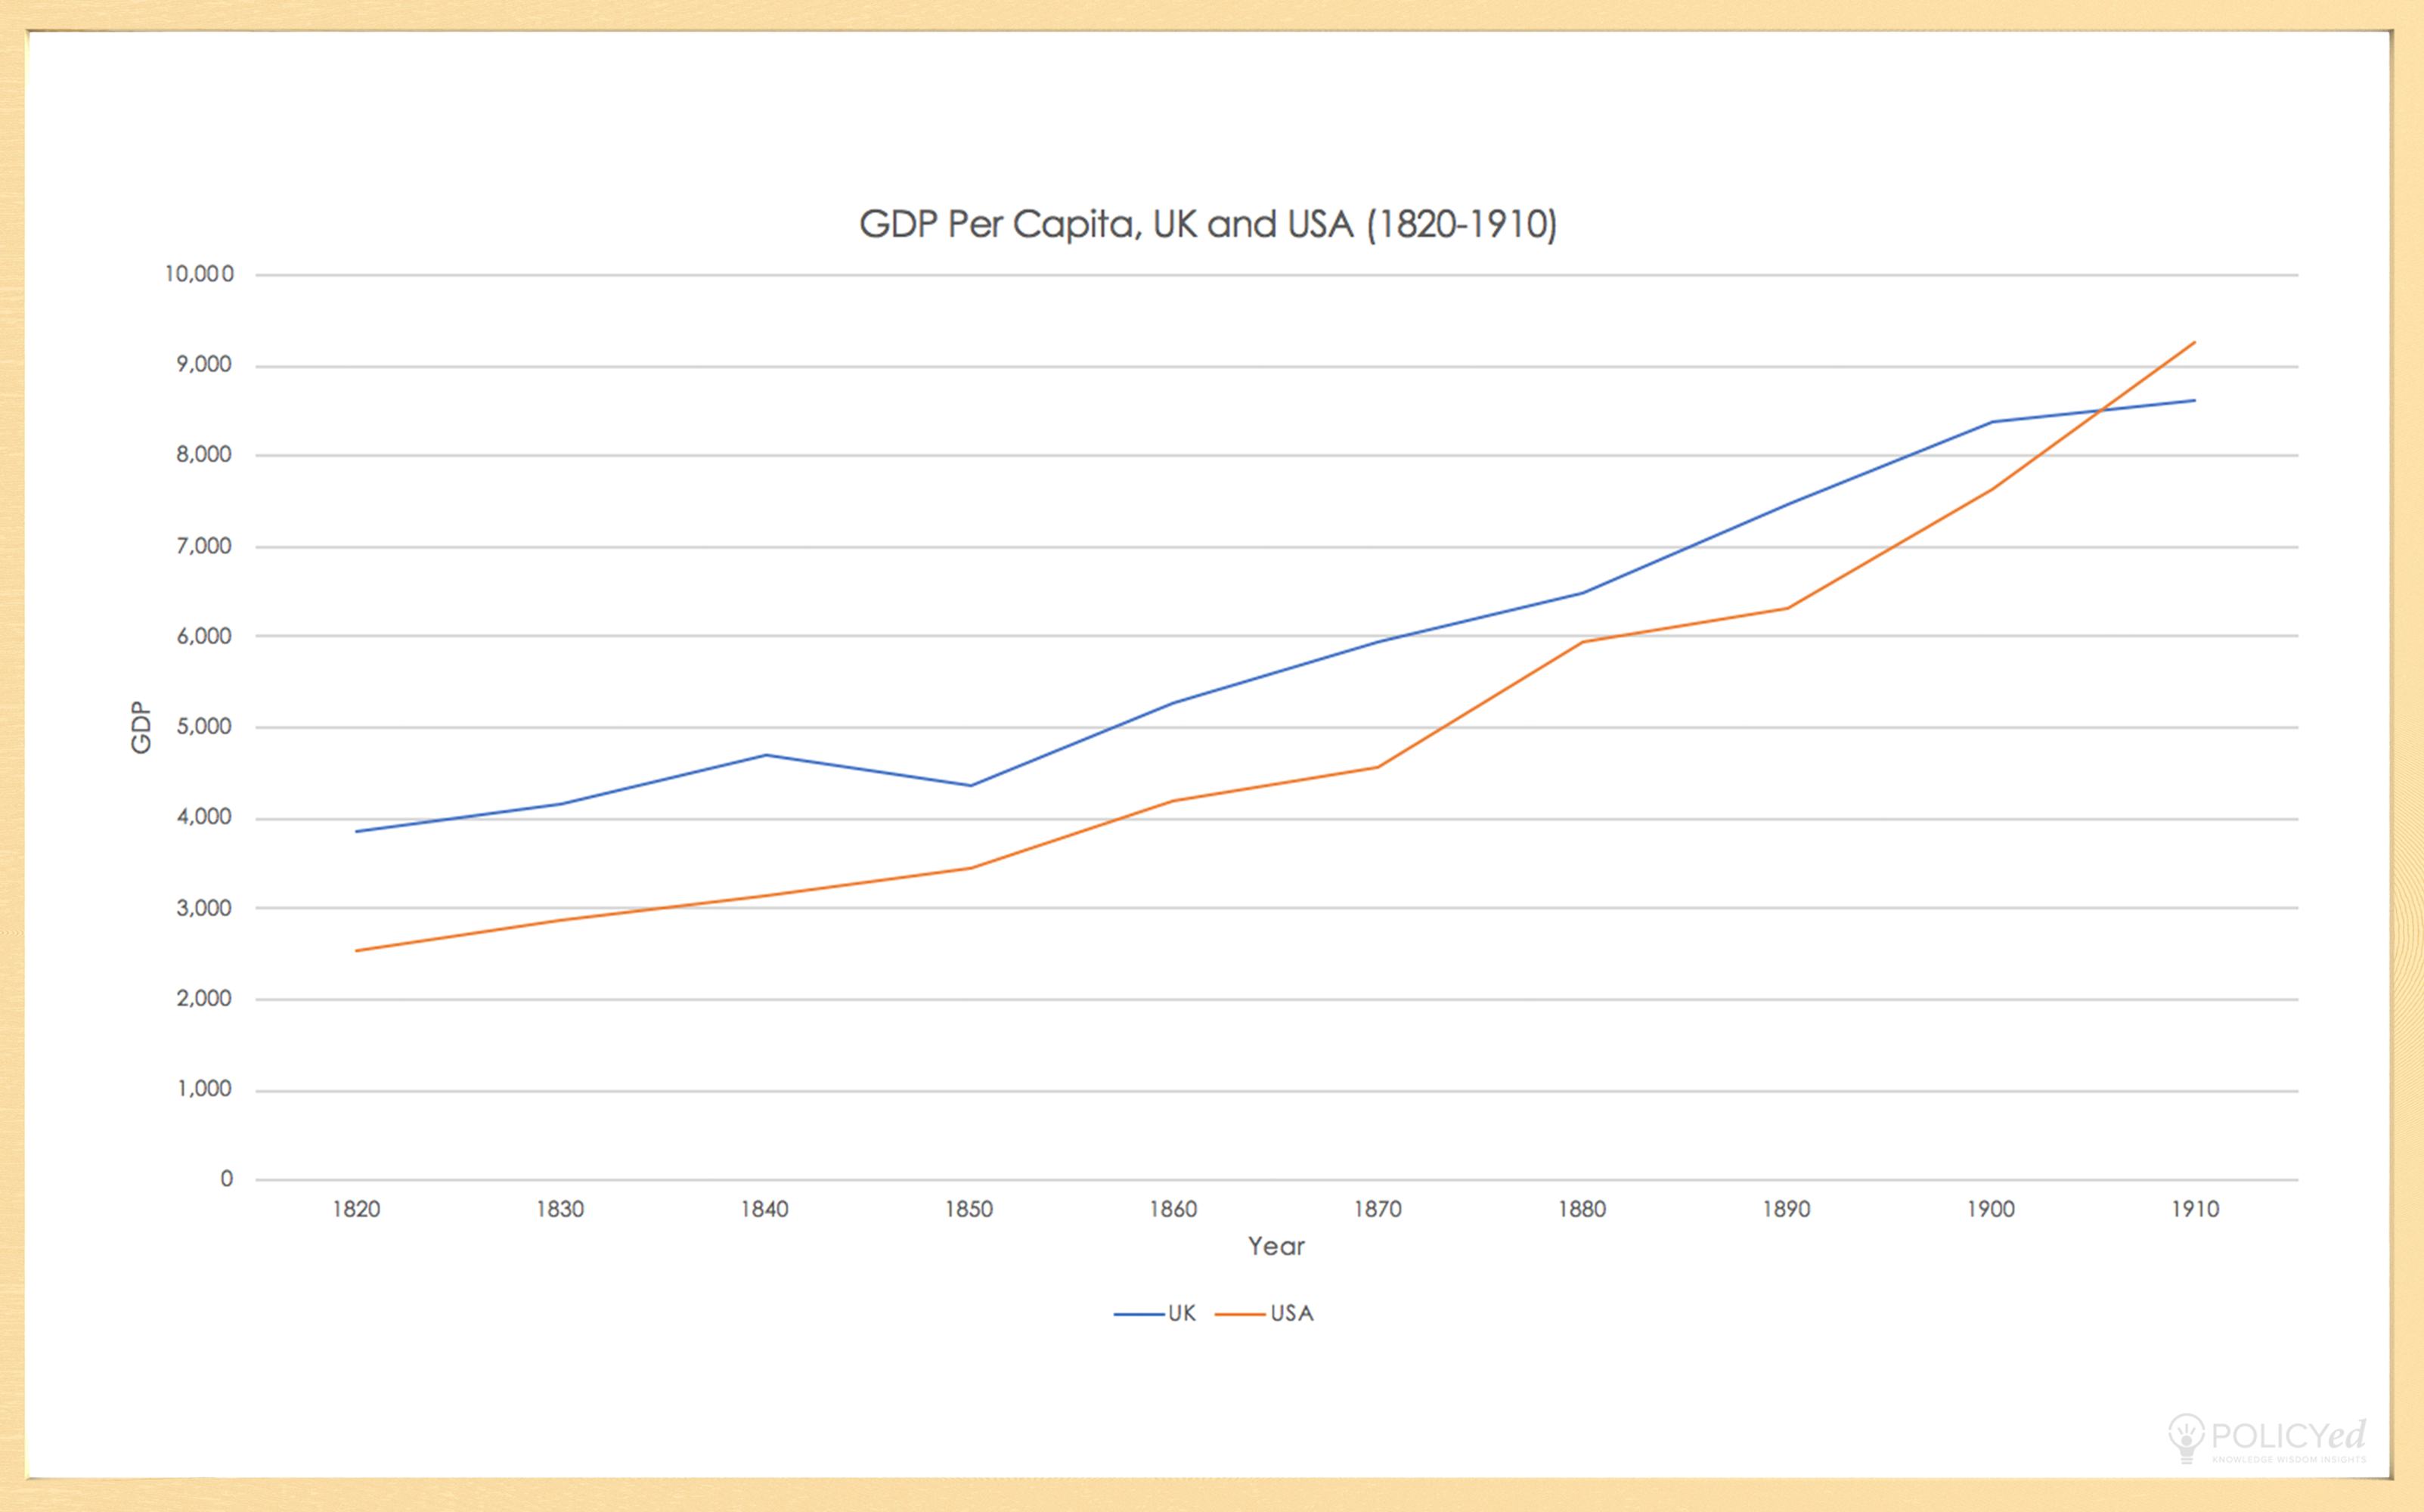
You can find these graphs in “America’s Exceptional Economy,” the first video from the Examining America’s Exceptional Economy series with Ed Lazear. They measure the growth of GDP per capita for the U.K., France, Italy, Canada, Japan, and the United States over time, going back to the 1820s. While Britain had led in terms of GDP per capita, the United States surpassed them in the early 1900s and after World War II, started to pull ahead quite significantly. In 2010, America was 28% richer than Britain, 22% richer than Canada, and 65% richer than Italy.
Average Annual Growth Rates
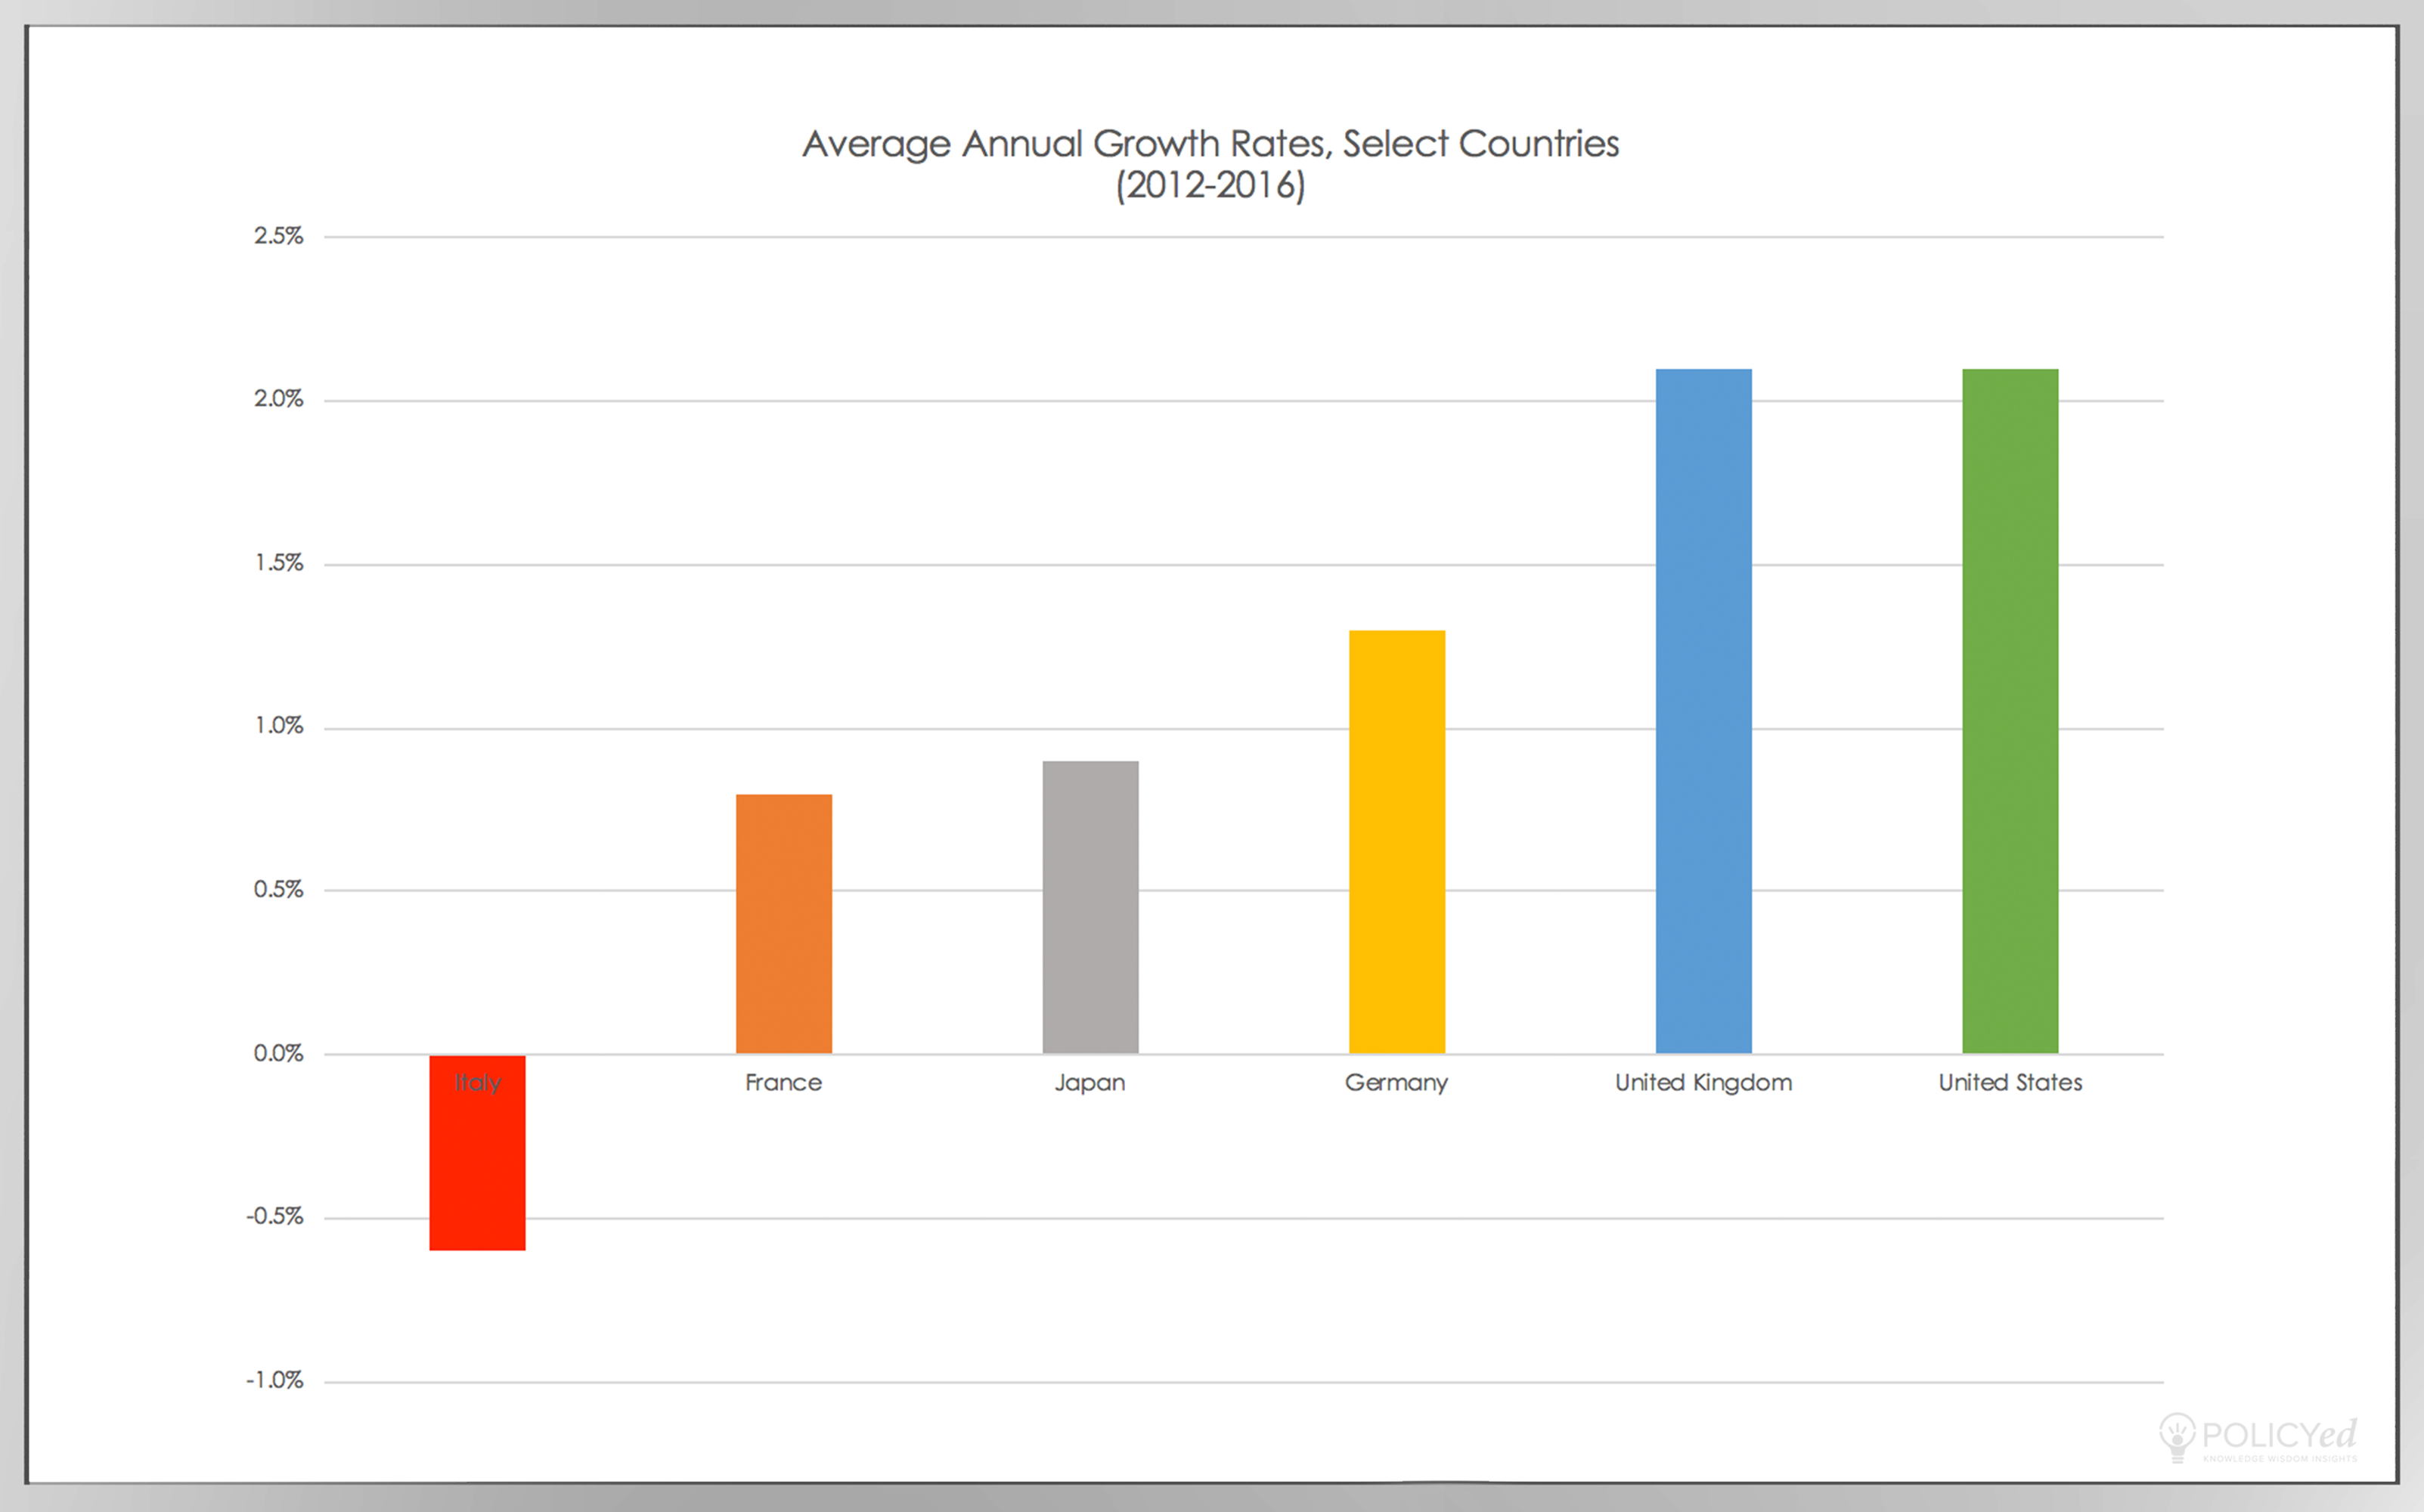
This graph shows that the American economy has been robust. The U.S. growth rate between 2012 - 2016 was 2%, despite increases in capital taxes and regulations.
G7 Nations' Average Unemployment Rate
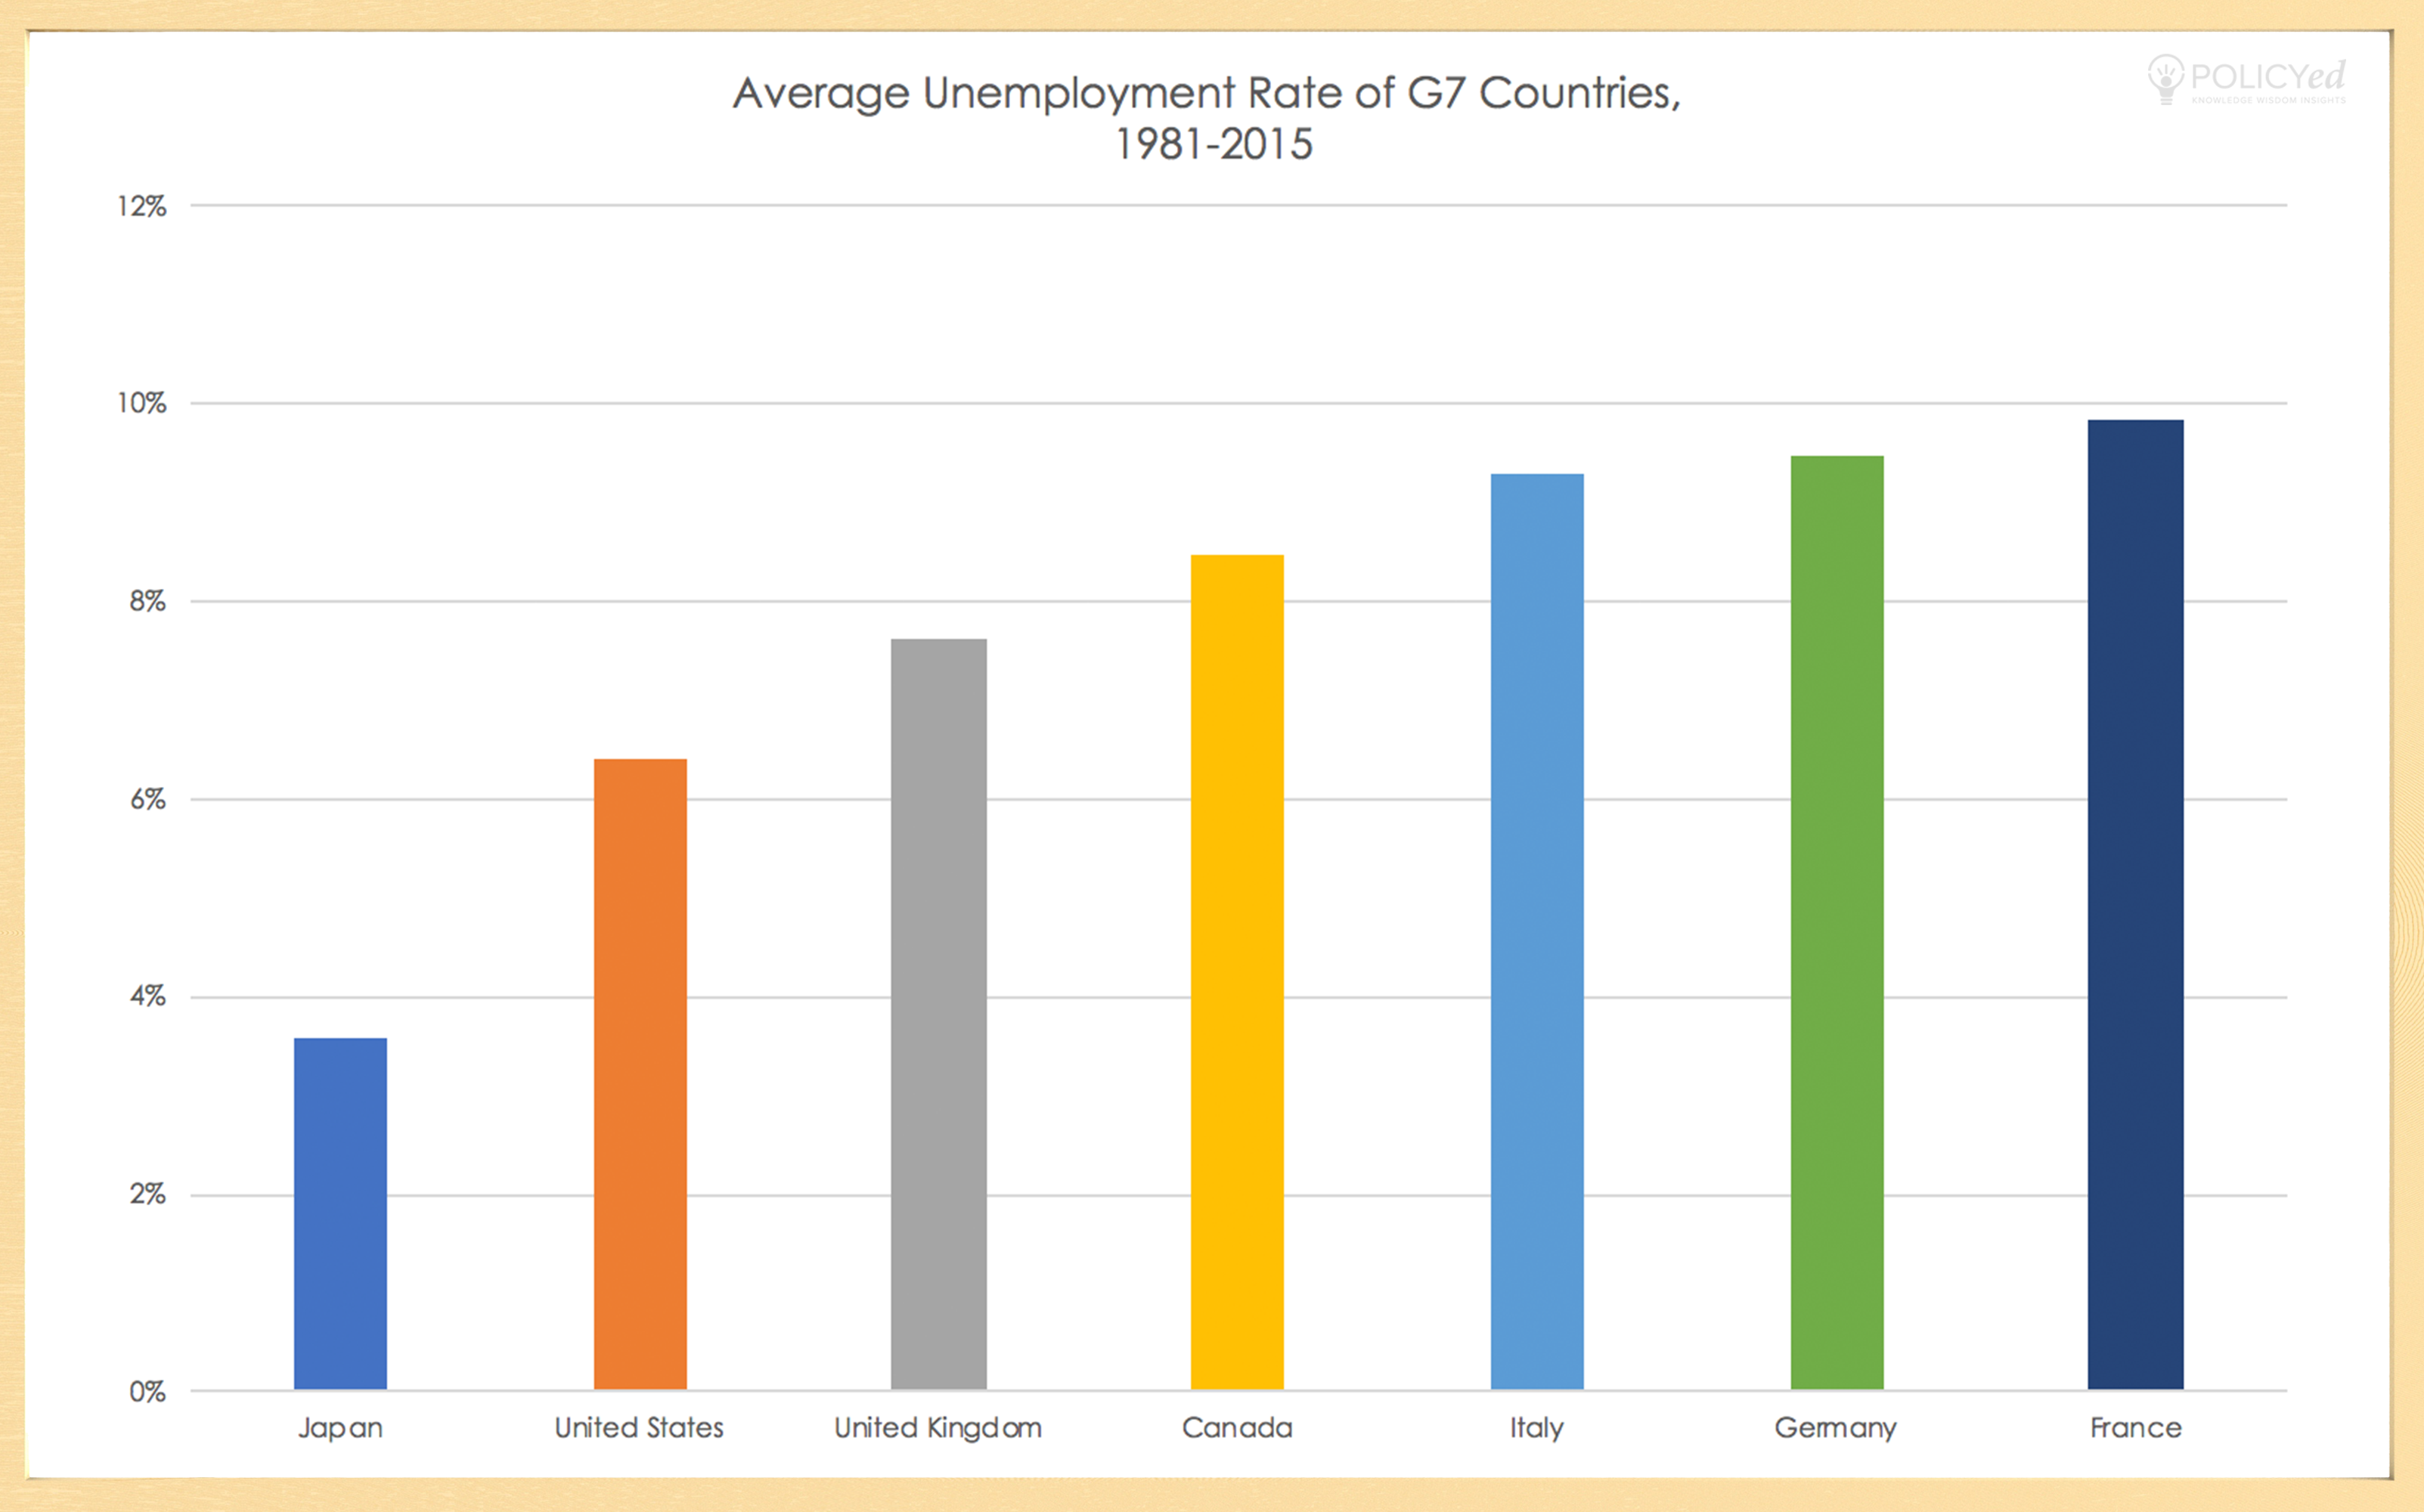
The average unemployment is pretty low in the United States. In fact over the last 30 years, the unemployment rates in the United States, on average, have been lower than just about every comparable country in the world. Japan, on the other hand, is an exception. While Japan has a low unemployment rate, it also has a stagnant, impacted labor force. The United States, however, has low unemployment rates and the most dynamic labor market in the world.
Parental Income Quintiles
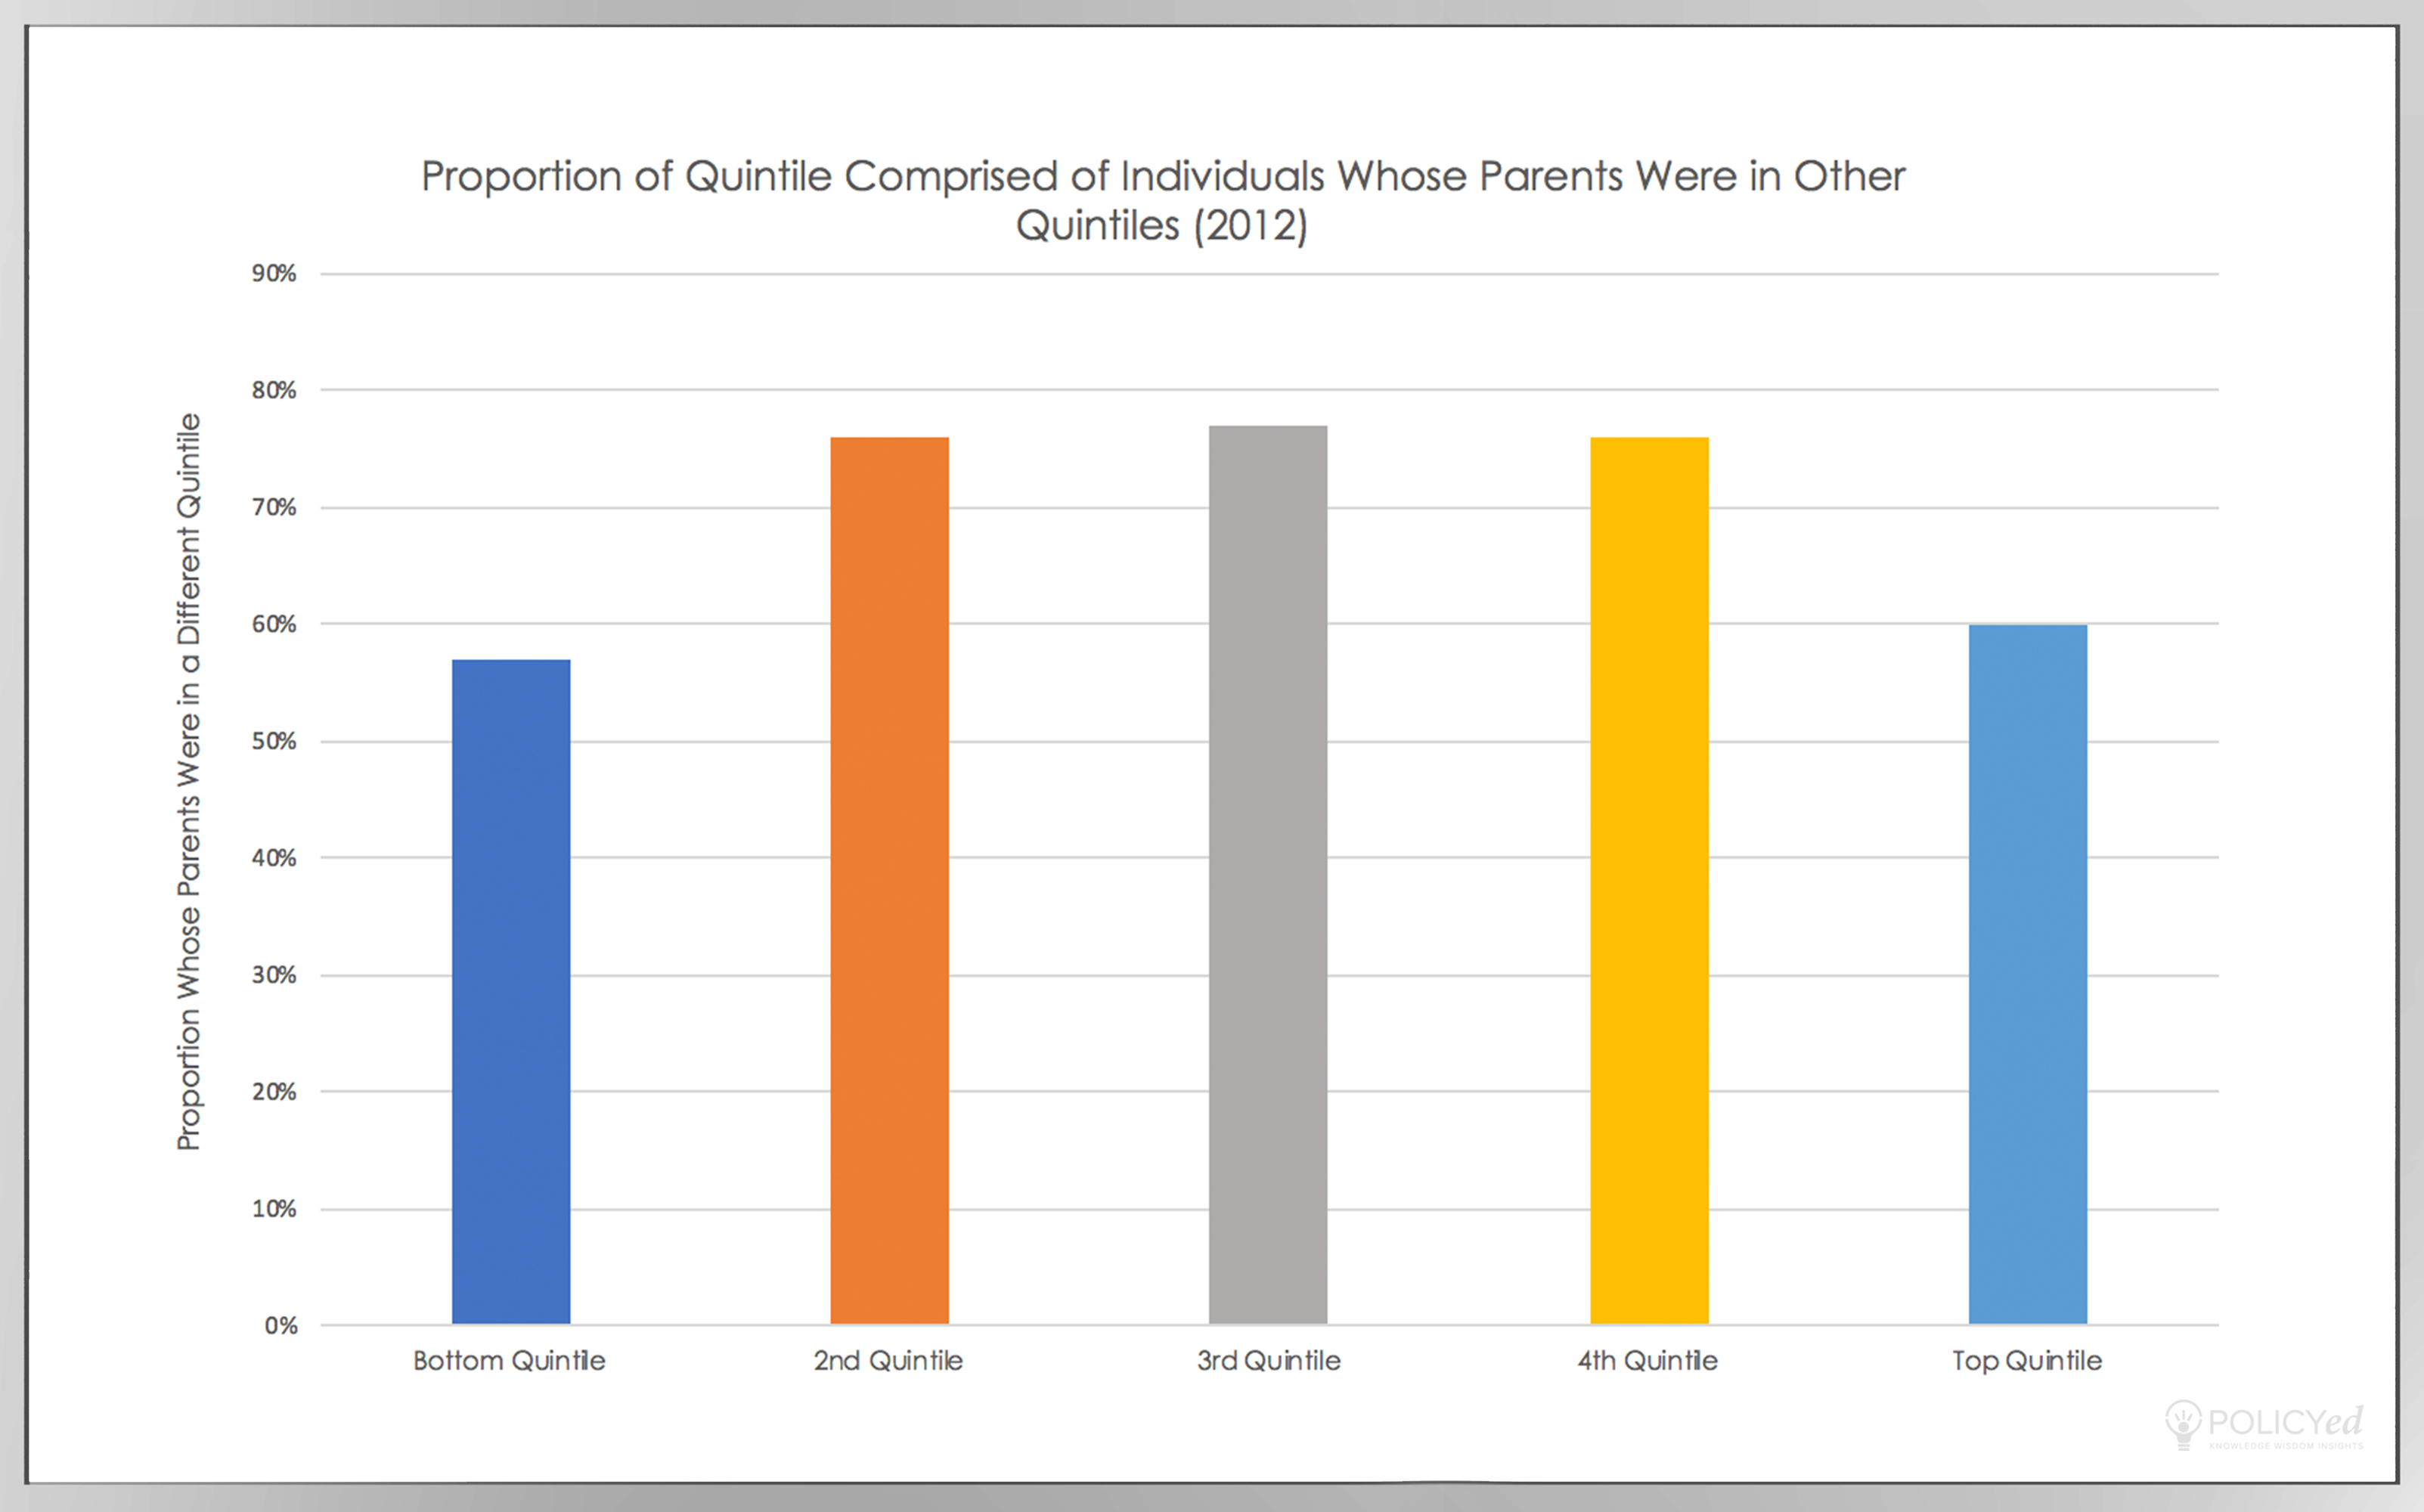
The United States has a fluid nature of economic mobility as Americans can move up successfully. This graph illustrates how, for each income quintile, the majority of individuals had parents that were of a different income group than them. In fact, the majority of people who are at the top now did not grow up in those circumstances. Moreover, the majority of people who are born into families in the lowest 20% of earners moved out of that category.
Income Factors for G7 Nations
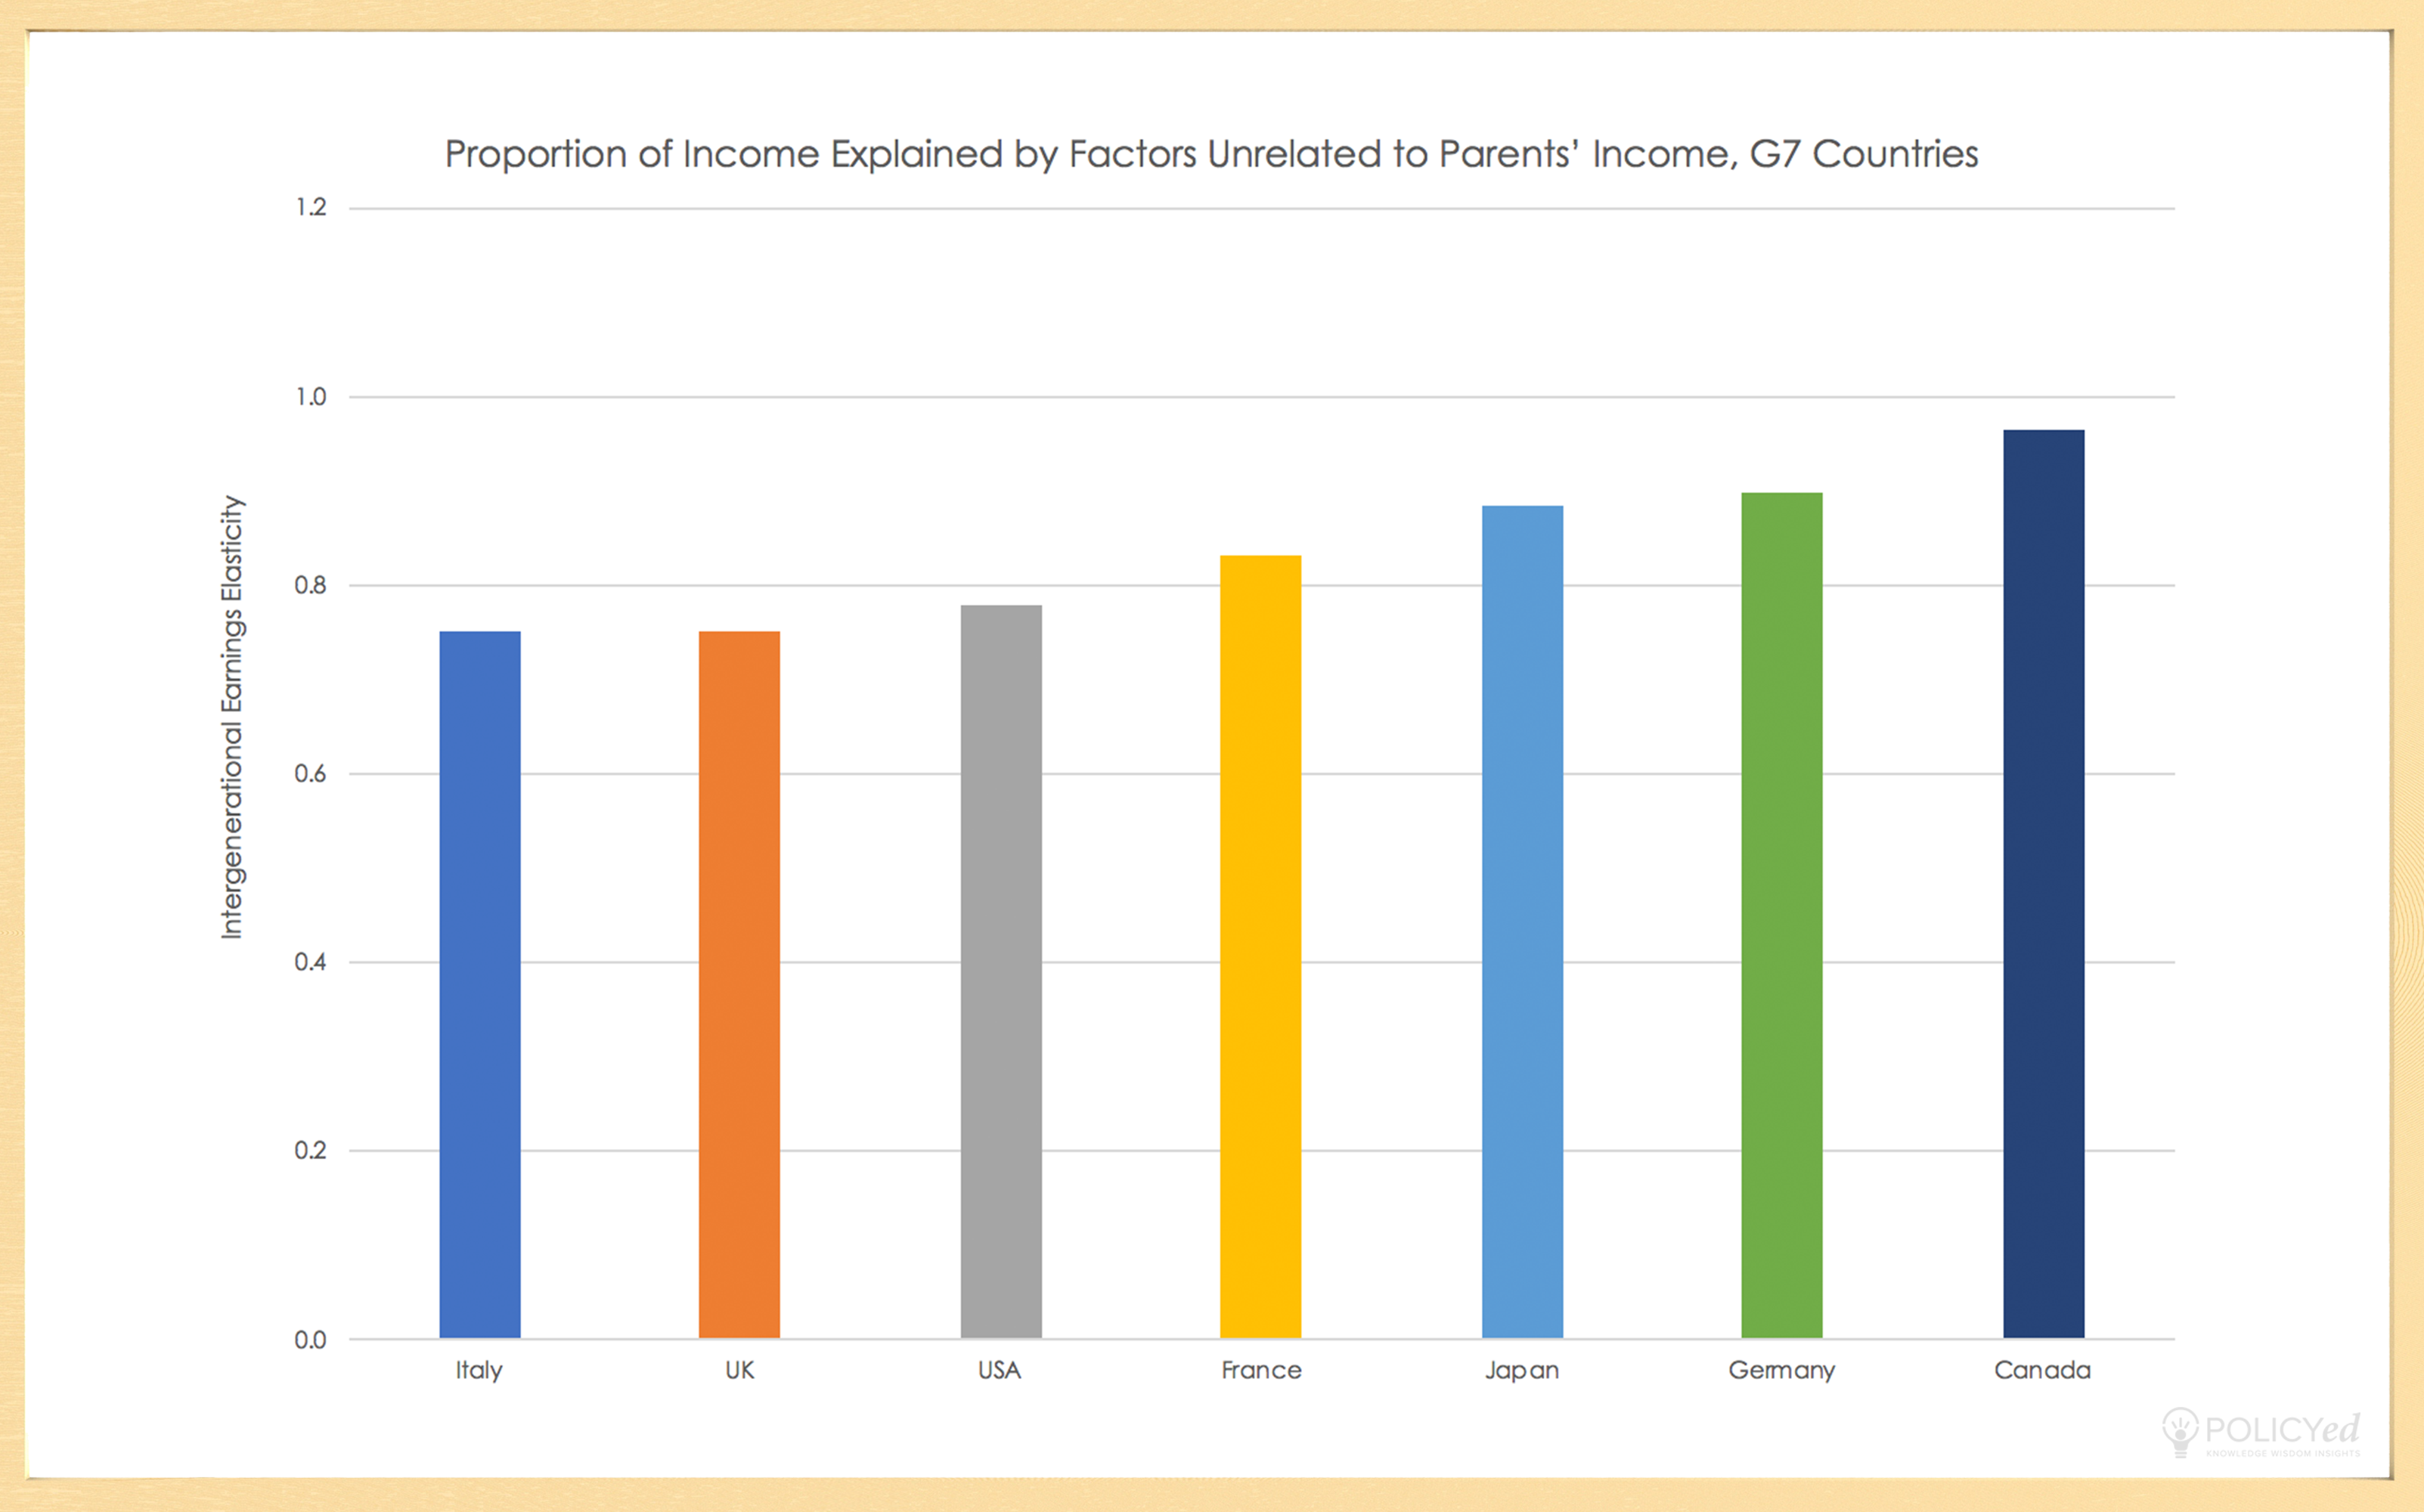
Generally, where you end up economically is independent of where you were born in terms of your income or your status. This graph shows how in Italy, the U.K., the United States, France, Japan, Germany, and Canada, the majority of a a child’s income is determined by their means instead of by their parents' wealth. Canada is the leader in mobility with 95% of income being determined by factors other than parental income, while the United States is at 78%.
Granted Visas vs. Waiting List for Visas
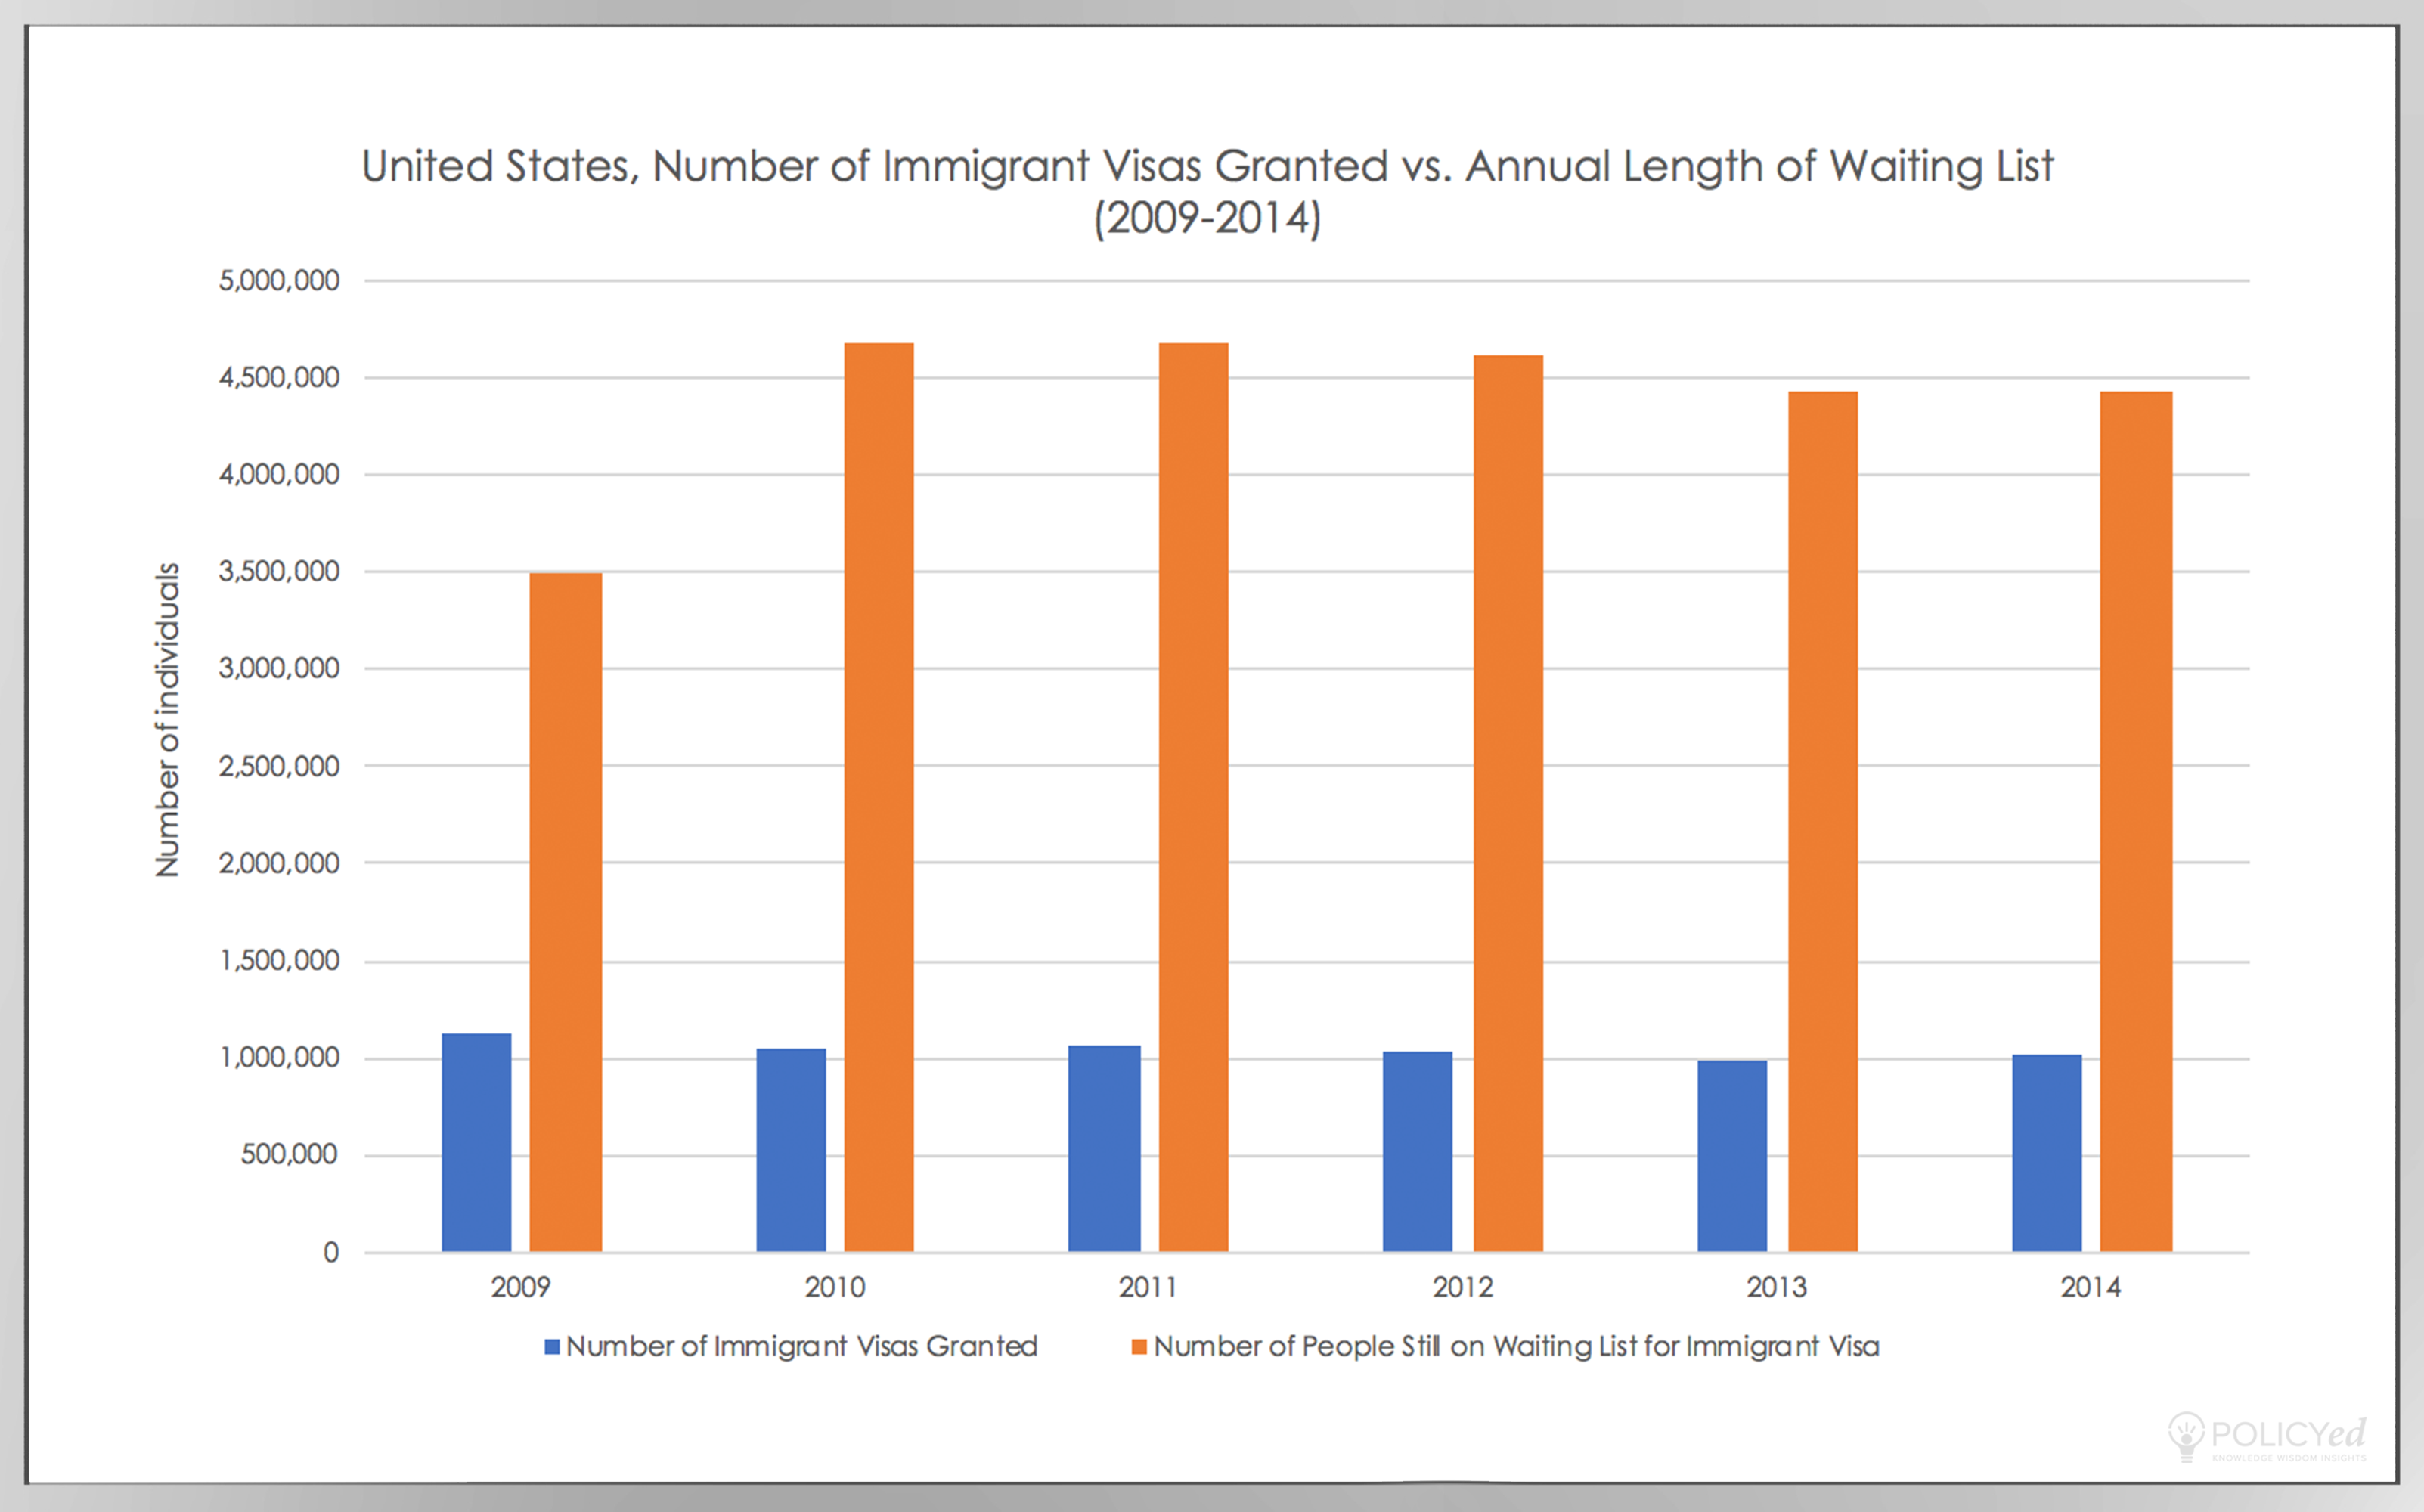
This figure shows the stark comparison of individuals applying to become permanent residents of America versus the individuals that are accepted. Even though the immigration process can be complicated, time consuming, and costly, America is still where many people in the world want to end up.
Preferred Country
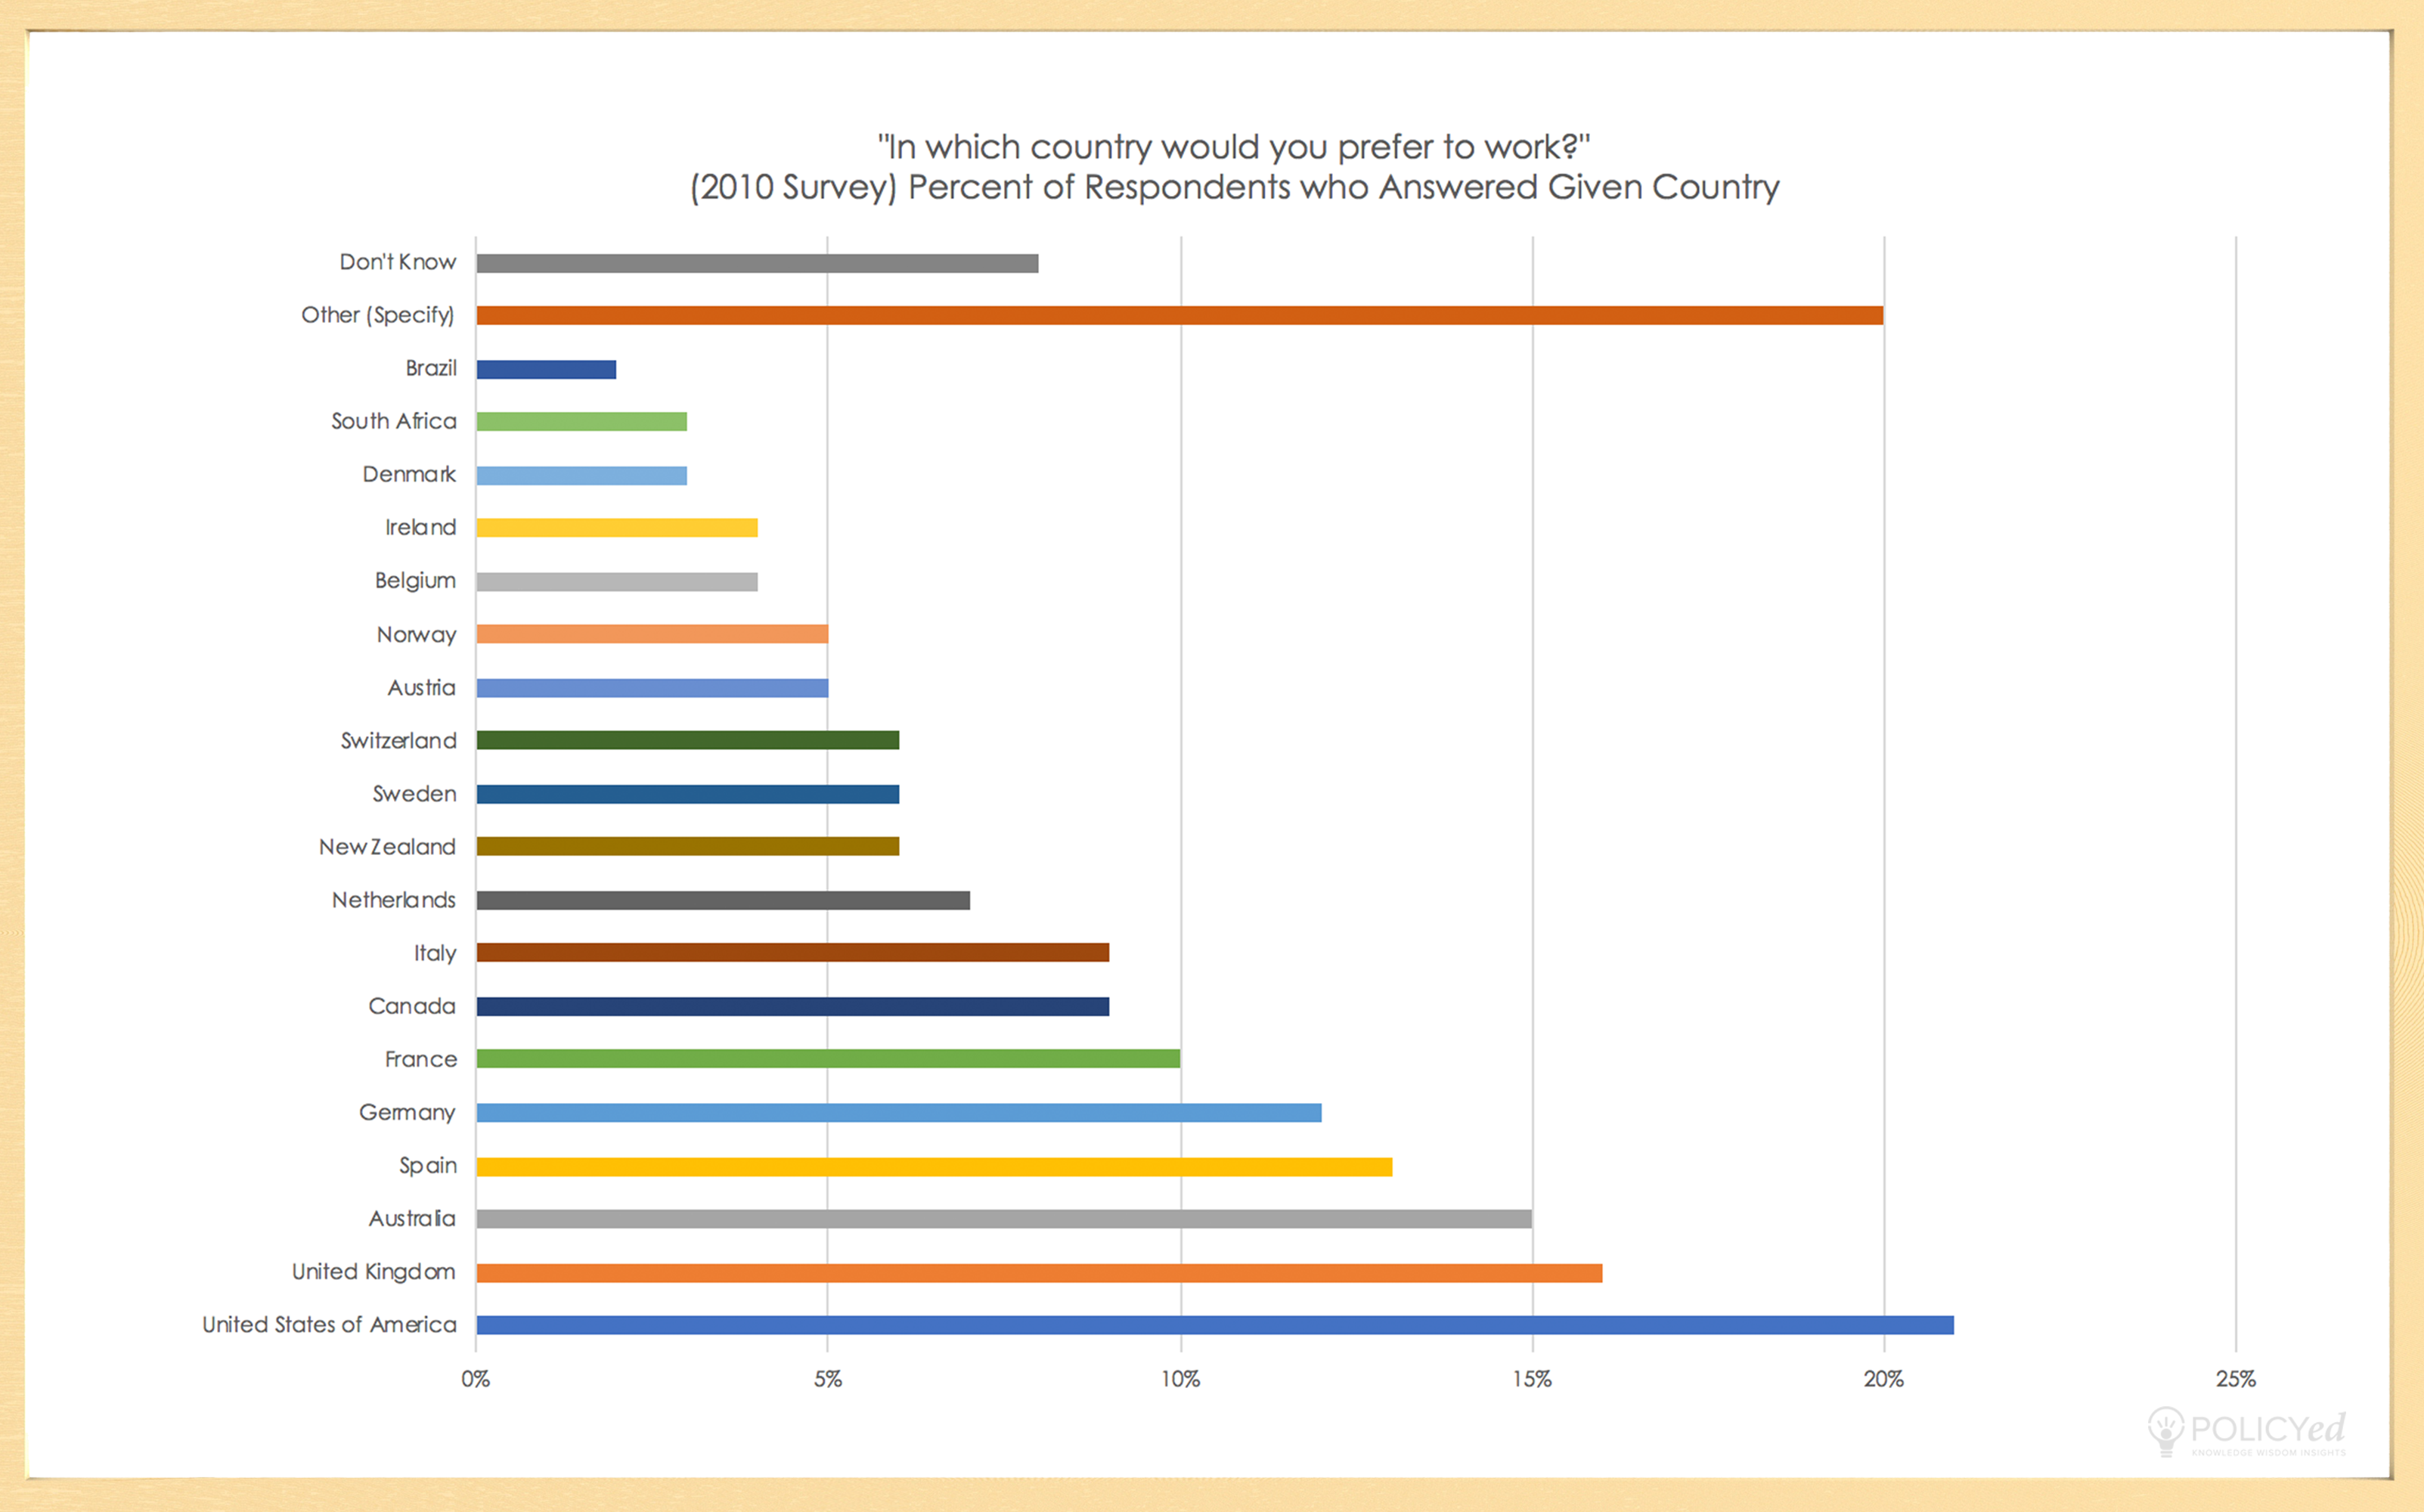
America’s relatively strict immigration policies do not deter people from applying. Many people prefer to work in the U.S., followed by the U.K. This graph clearly illustrates the desirability of America as an employment destination, as well as the attractiveness of developed, market-based countries in general.