Economic Growth
Can We Grow Faster?
America’s economy hasn’t been in a recession for almost a decade. Growth has been slow but positive. Many people believe this is the best the economy can do considering the circumstances. Is that good enough?
Not necessarily. Could the economy actually be doing better? The answer is yes. History has shown us that growth rates can and should be higher than the 1.7 percent we’ve averaged for the last twenty years. With the right economic policies, higher growth is well within our reach.
The conversation about economic growth isn’t just for economists. Growth affects every individual’s standard of living. But it is harder to see what we’re losing with slow growth than negative growth. That’s why it’s so important to know what faster growth used to look like and what it could mean for us today.
Why should people be worried that we’re not growing at 3 percent?
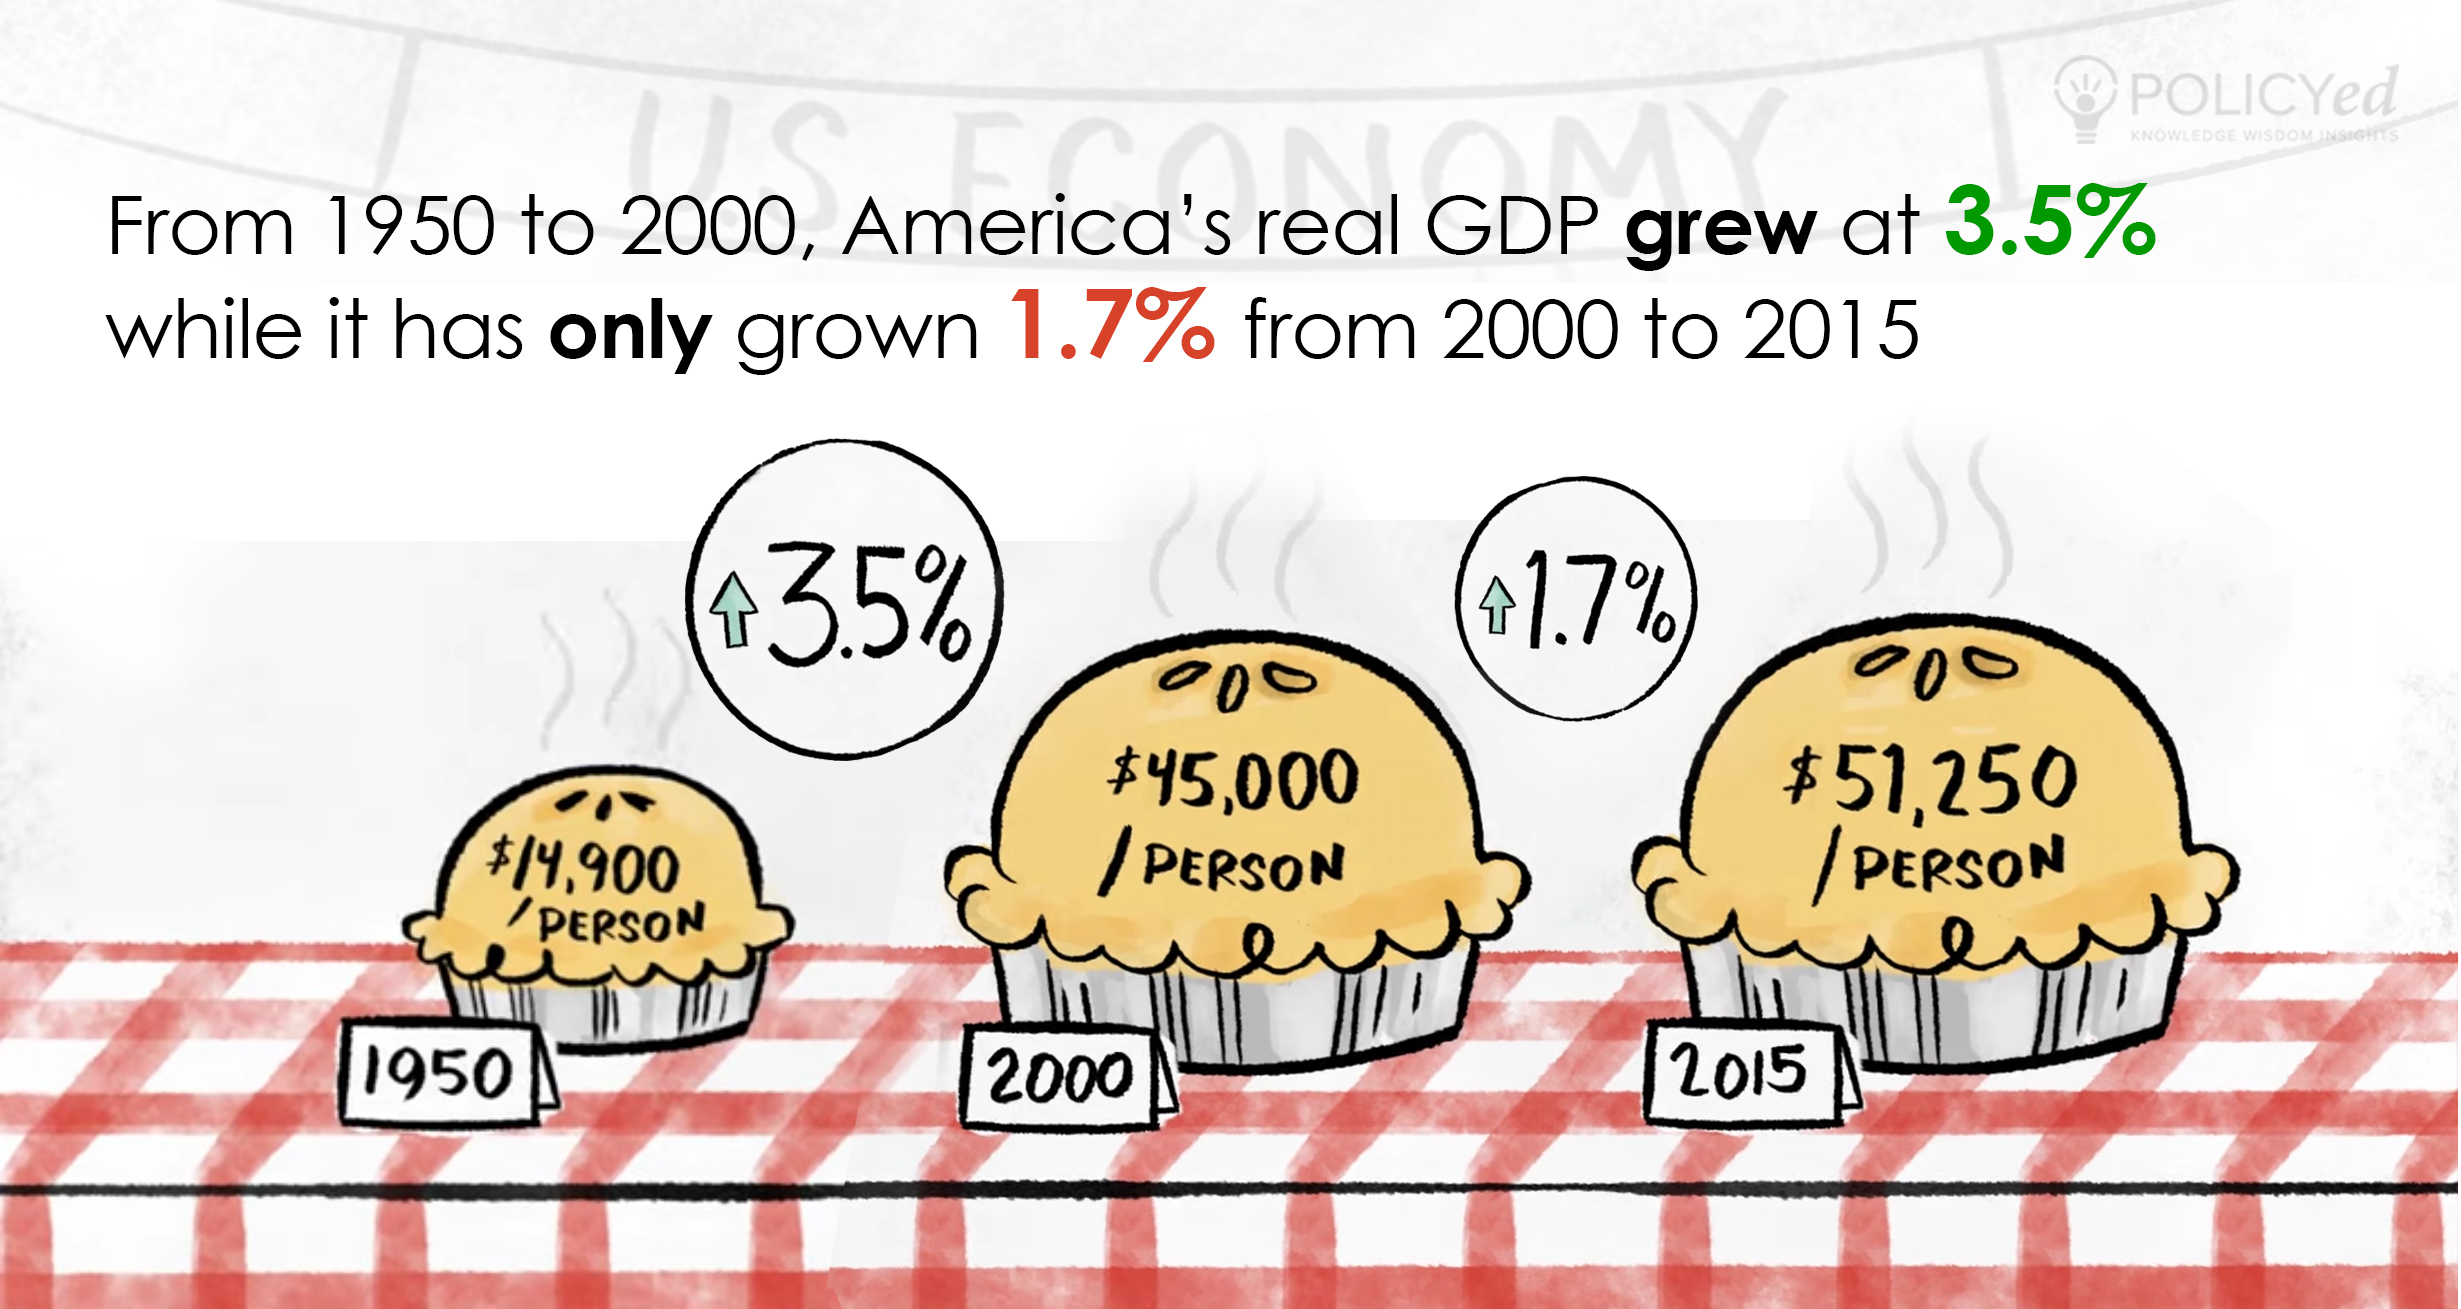
From 1950 to 2000 America’s real GDP per capita grew at 3.5 percent. Incomes after inflation tripled, going from $16,000 to $49,000 per year.
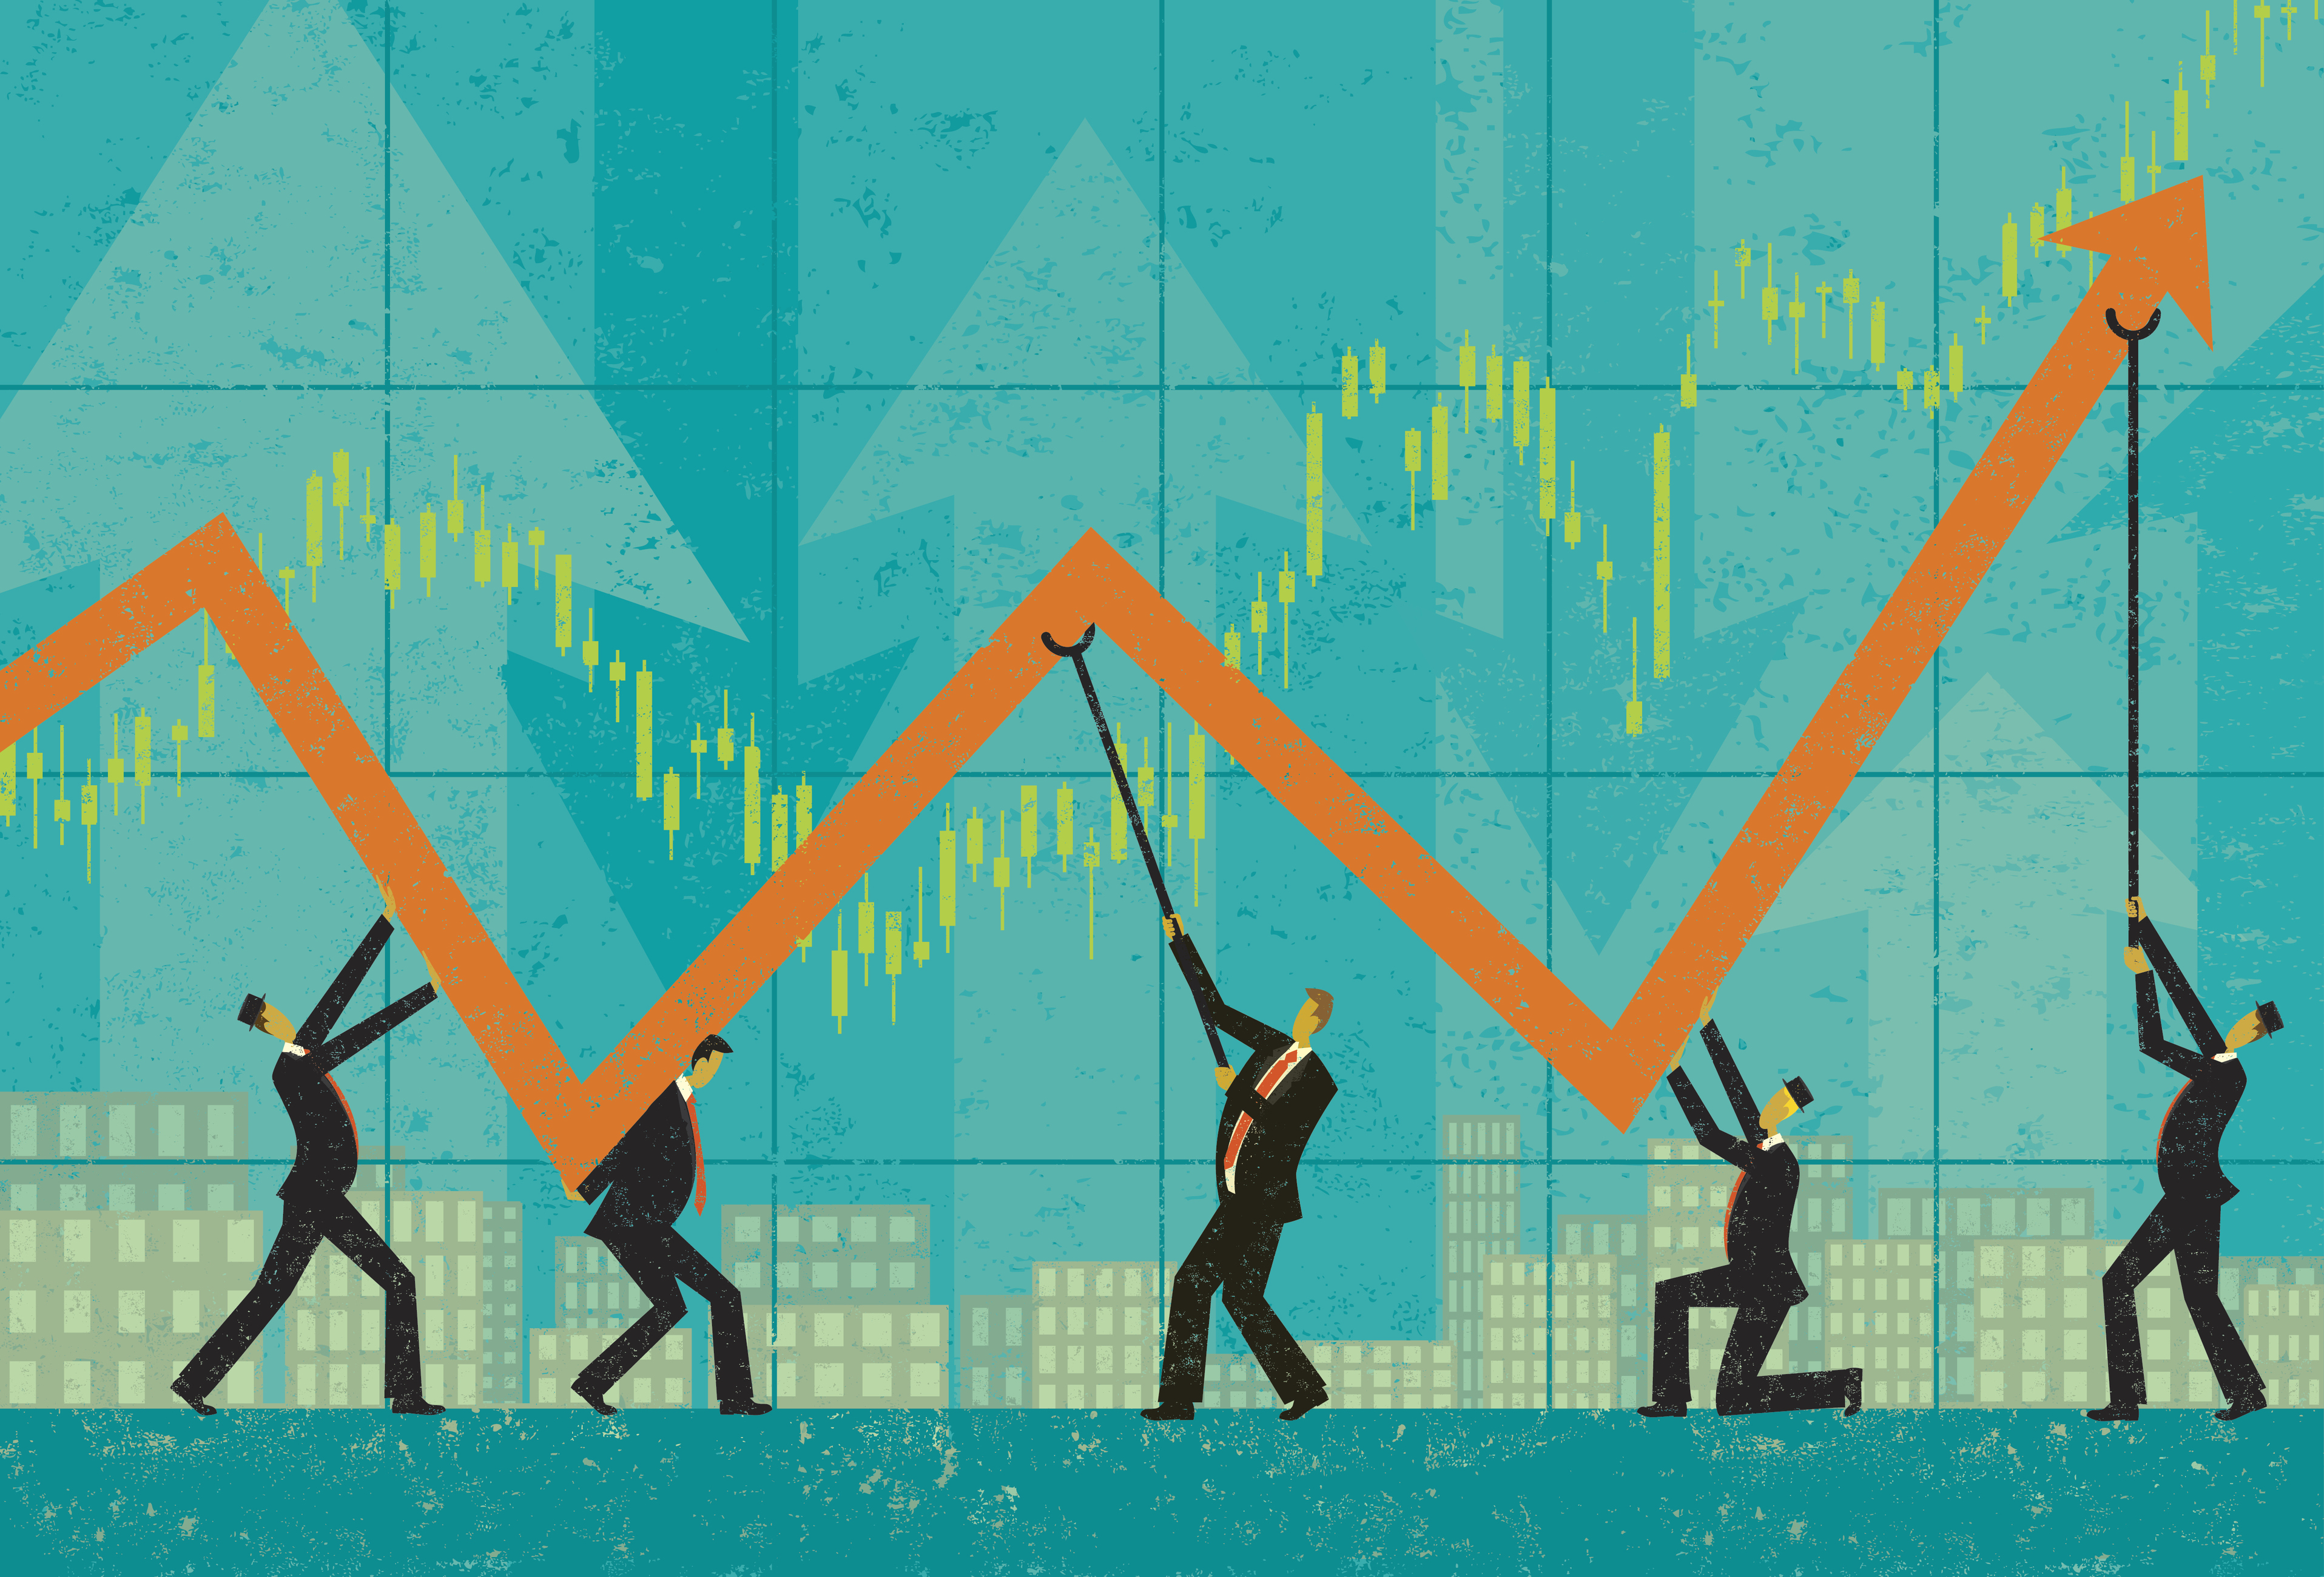
But as economist John Cochrane points out, we’ve grown at half that rate since 2000. Even recovering from the 2007 recession happened at a much slower rate than we’ve always seen after recessions.
[Read “Ending America’s Slow Growth Tailspin” by John Cochrane]
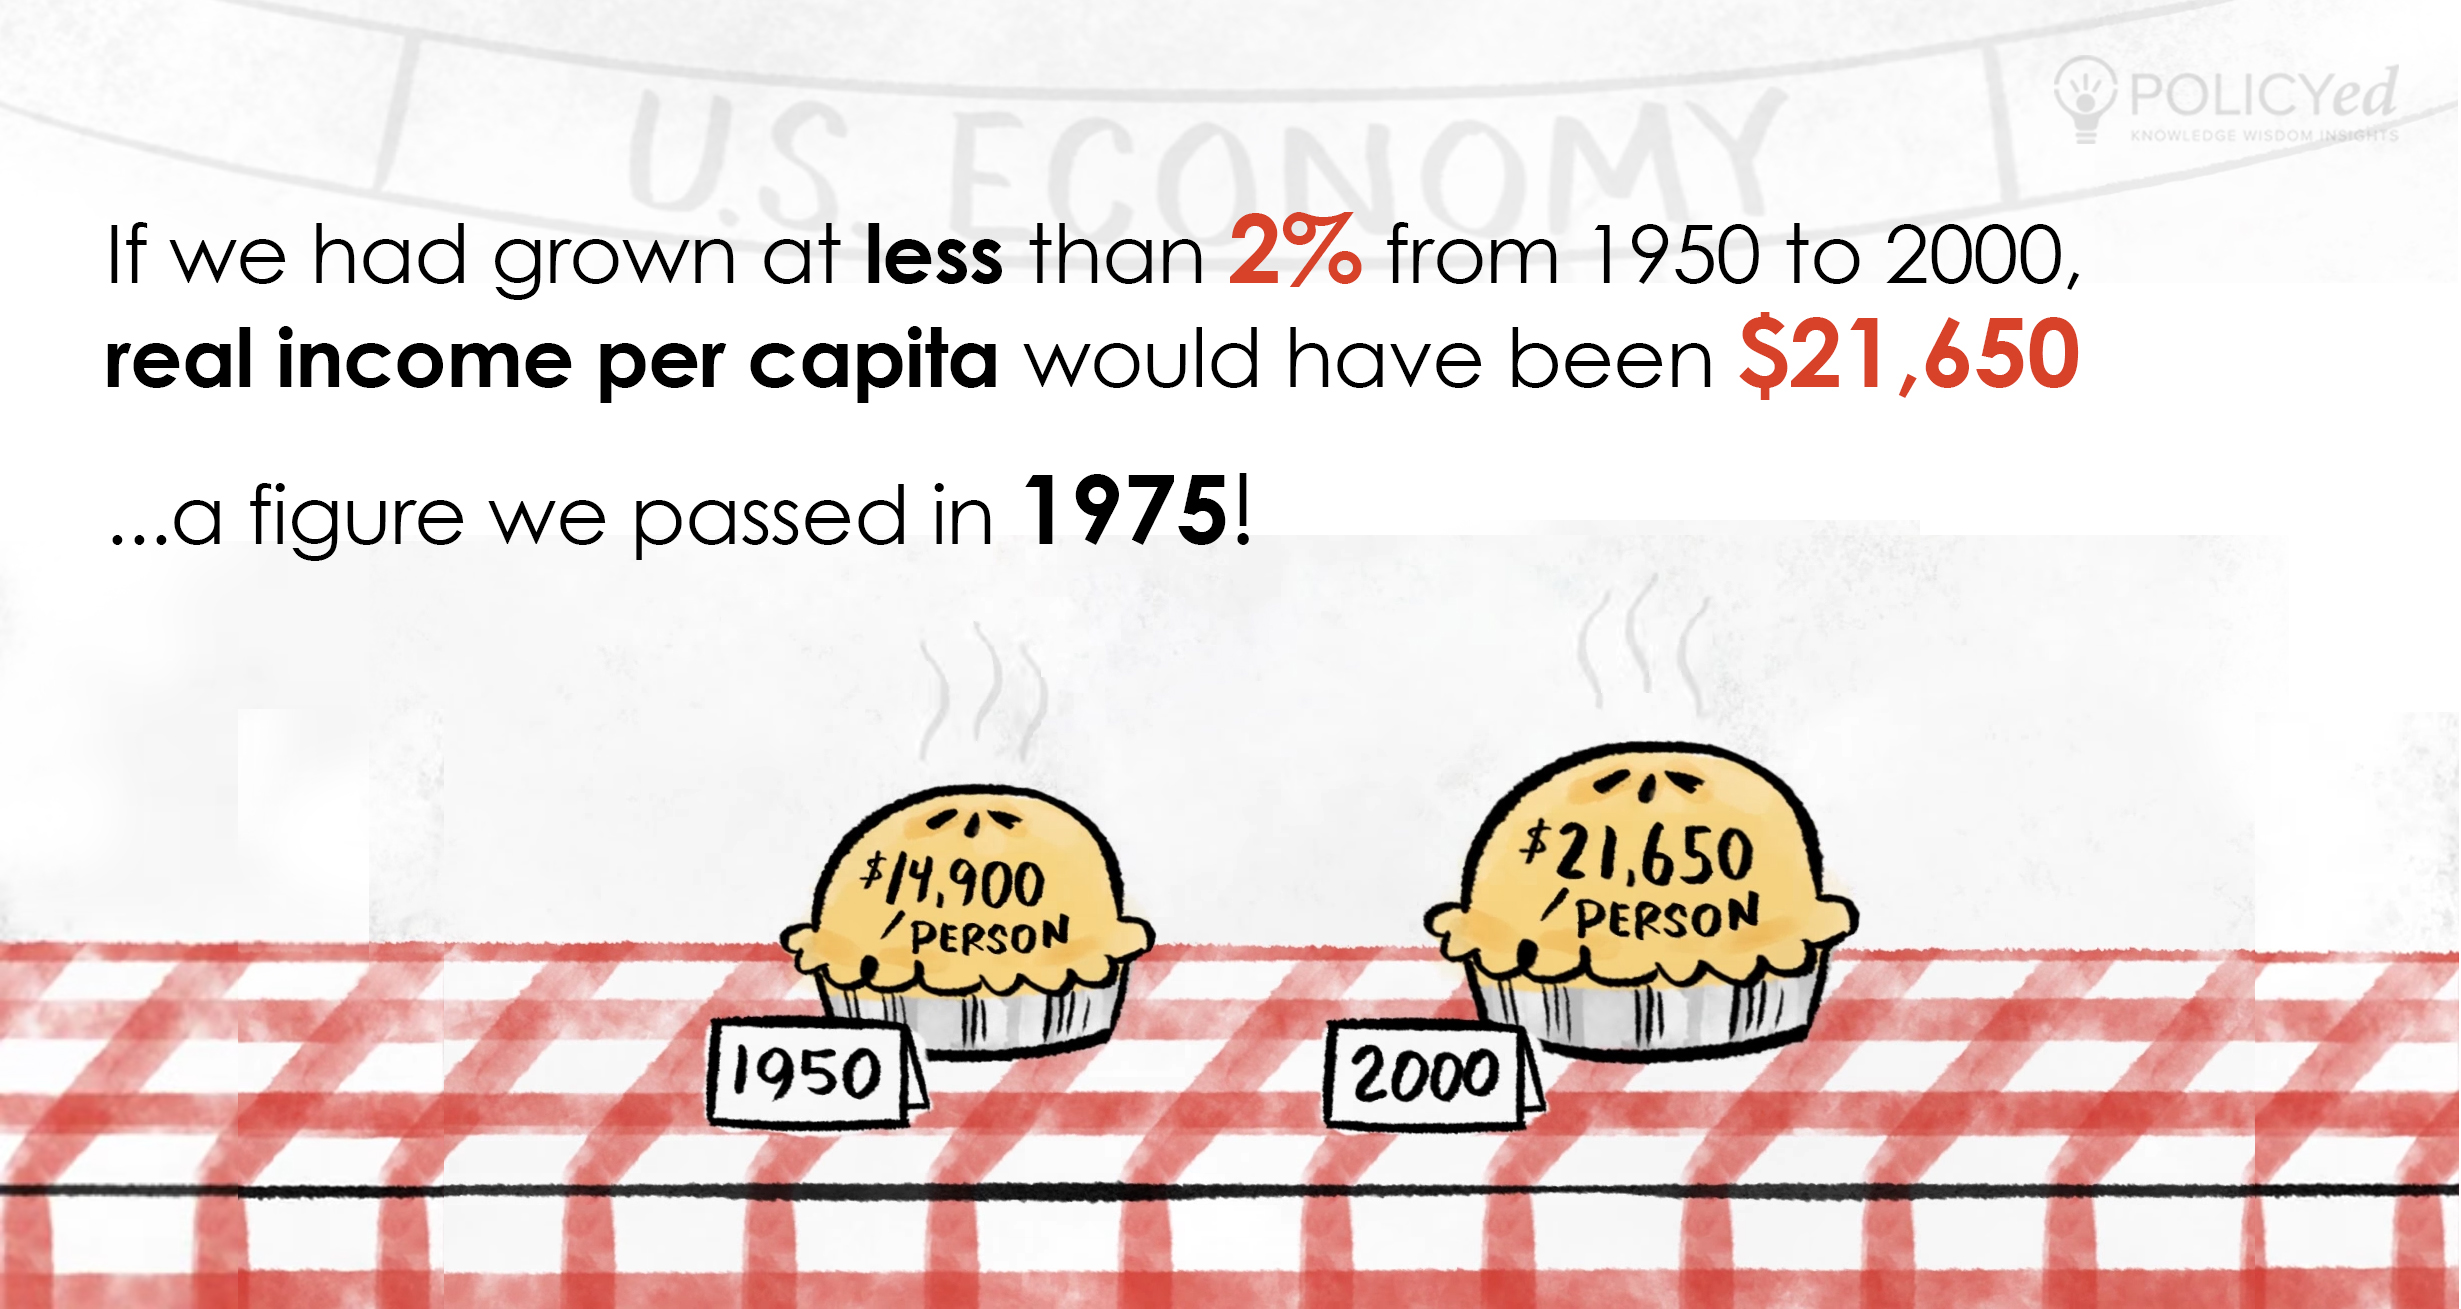
If we’d grown at 2 percent from 1950 to 2000, incomes would have only risen to $23,000 instead of $49,000. If we’d grown then like we’re growing now, we’d only just be reaching the income and quality of life that people had in the 1970s.
That’s no exaggeration. With slower growth comes less innovation and slower adoption of technology. It means fewer inventions, less job creation, and stagnant industries. Although life keeps getting better at less than 2 percent growth, it gets better at a much slower rate.
Here’s a minute and a half on what’s happened with growth and why it’s bad for us long term if we stay on a slow-growth path:
Is a one and a half percentage point reduction that big of a deal? After all, we’re still growing.
A one percentage point reduction doesn’t seem like much of a difference, but over time it leads to enormous differences in workers’ paychecks, available technology and services, and our overall quality of life.
After all, the way percentages work means that increasing our 2 percent growth to 3.5 percent is a 75 percent increase in the rate of growth.
With 3 percent growth, we double incomes every twenty-four years. With 2 percent growth, we double them every thirty-six years.
Haven’t all of the gains from growth gone to those at the top? What’s the use of growth if it’s not going to help the people who need the most help?
You hear all the time that lower-income groups in America haven’t seen an increase in their paycheck in decades. That’s not the case.
If you’re in the mood to listen to a podcast, you can turn to EconTalk with Russ Roberts in which he interviews Richard Burkhauser (now on the Council of Economic Advisers) on this very subject. (There’s also a transcript there if you’d rather read than listen):

The short answer is that the official way income is measured leaves out many sources of income, measures different groups of people, and uses assumptions that fail to compare accurately historical time periods to today.
What does that actually mean? The official way we measure income doesn’t count taxes or noncash government benefits. The number doesn’t include tax credits that go to low-income families, in-kind benefits like health care or food stamps, capital gains, and any other extra compensation from employers that are not taxed, most notably health insurance benefits.
How is that possible and how much does it change things? When the Census Bureau began measuring income, government transfers that weren’t cash welfare were very small, only a few percent of people’s incomes. But over time low-income tax credits, in-kind benefits, and nontaxed compensation have grown to be a much larger portion of people’s incomes—especially for low- and middle-income Americans.
As Russ Roberts explains in The Numbers Game video “How Is the Middle Class Doing?” measuring different groups of people can easily change our perception of how the economy treats the middle class.
What does comparing historical time periods and today mean? It matters which measure of inflation we choose to use to put dollars from years ago into comparable dollars today. I won’t bore you with the details, but there is good reason to believe that the CPI-U overstates inflation and shows less income growth than actually occurred. Hoover senior fellow Michael Boskin chaired the commission detailing the extent of the problem.
[Boskin's Commission Report on accurately measuring our standard of living, available here.]
Not only that, but households look a lot different today than they did a few decades ago. Household size and the number of earners affect the distribution of income in ways you wouldn’t expect. Incomes were more equal when there was a smaller gap in the number of people working between low-income and high-income households. That gap has grown and with it so has the disparity among household income.
Okay, so growth is good, faster growth is better. What will it take to get back to faster economic growth?
Let’s back up and start with how to think about and measure economic growth. After all if you don’t know where you’re going, you can’t figure out how to get there.
If you want the minute and a half video explanation, watch "The Formula for Economic Growth:"
If you’re in the mood for five pages of a more in depth explanation of how to measure economic growth, here’s a paper in PDF form from economists John Cogan, Glenn Hubbard, John Taylor, and Kevin Warsh.
Here is their key paragraph on thinking about growth:
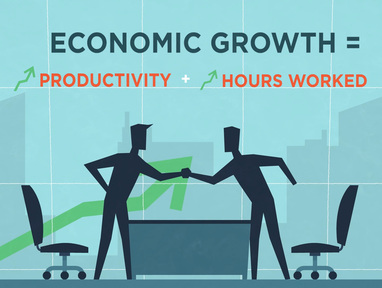
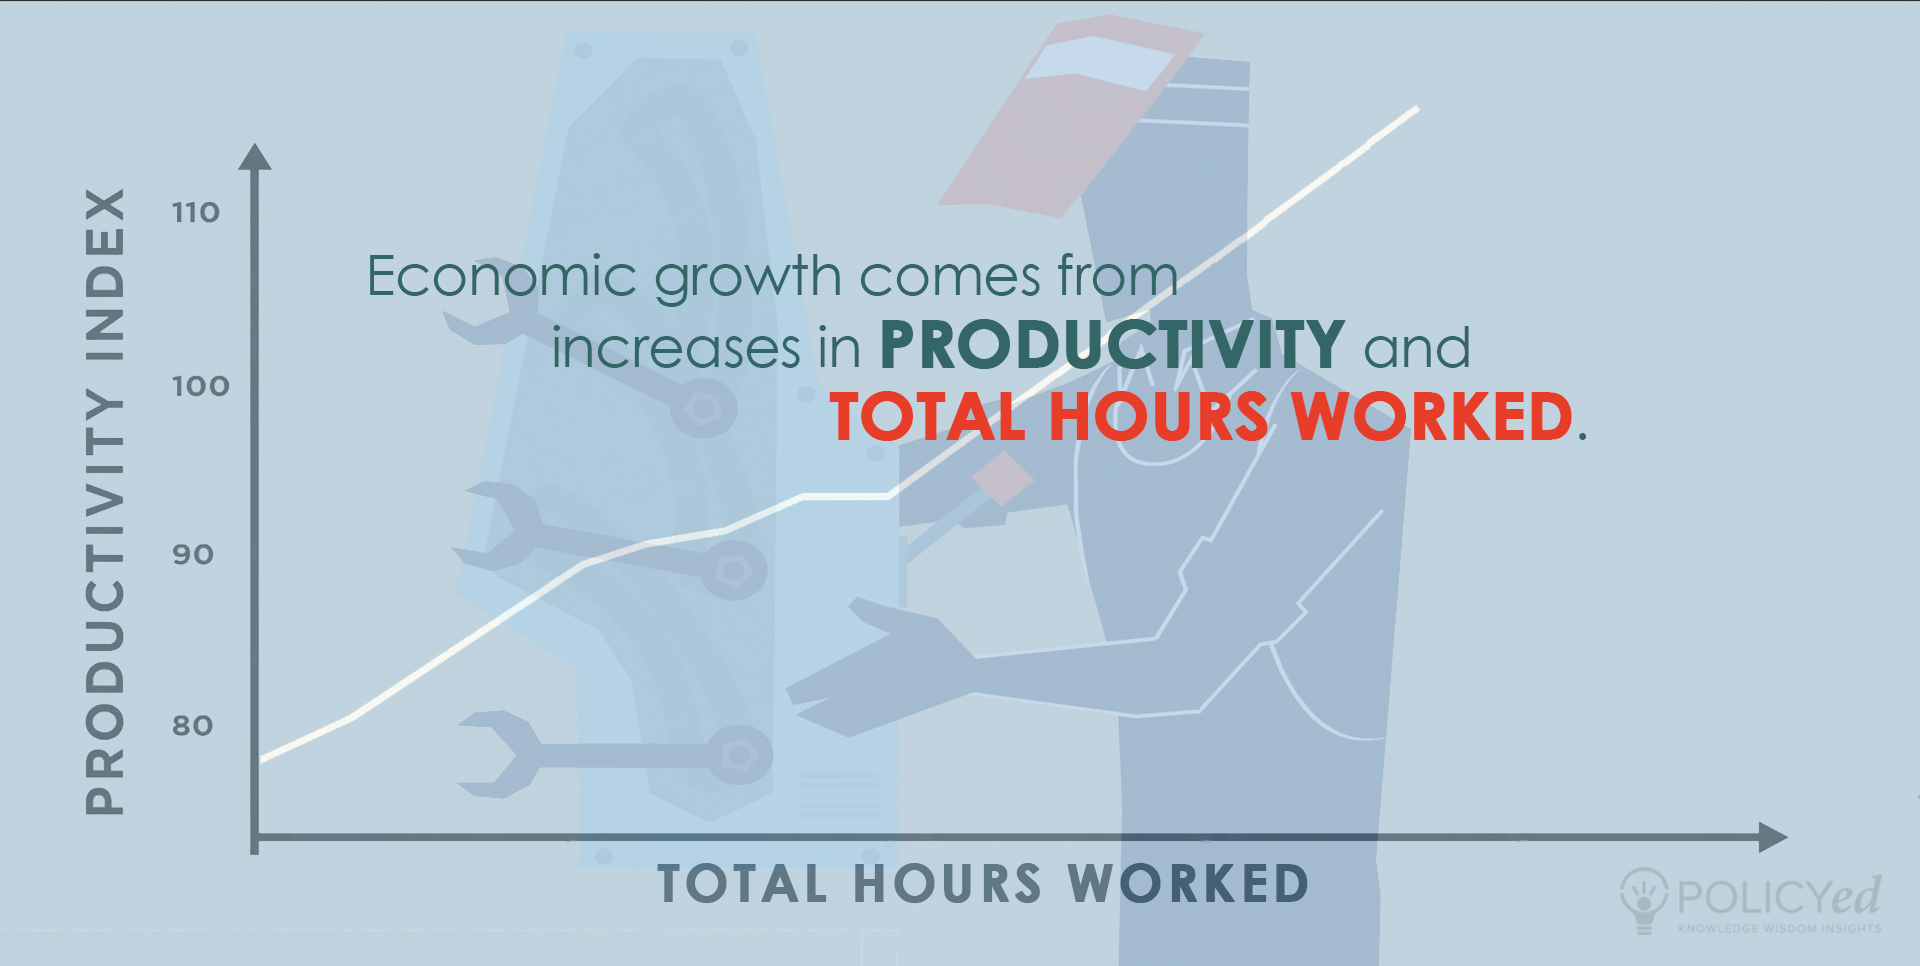
"Economists focus on the two proximate determinants of growth: productivity growth—the increase in production of goods and services per hour of work—and total hours of work. And, as we review each factor in turn, we are confident that US growth can be materially higher than the reality of the post-crisis era."
In short, the economy grows when the combination of productivity and total hours worked increases. It’s not that economic growth leads to productivity and more work. It’s that when we measure what’s happened with those two things, we end up with a number for economic growth.
Thinking about economic growth in this way allows for easy interpretation of policy and a quick way to judge whether something will hinder economic growth.
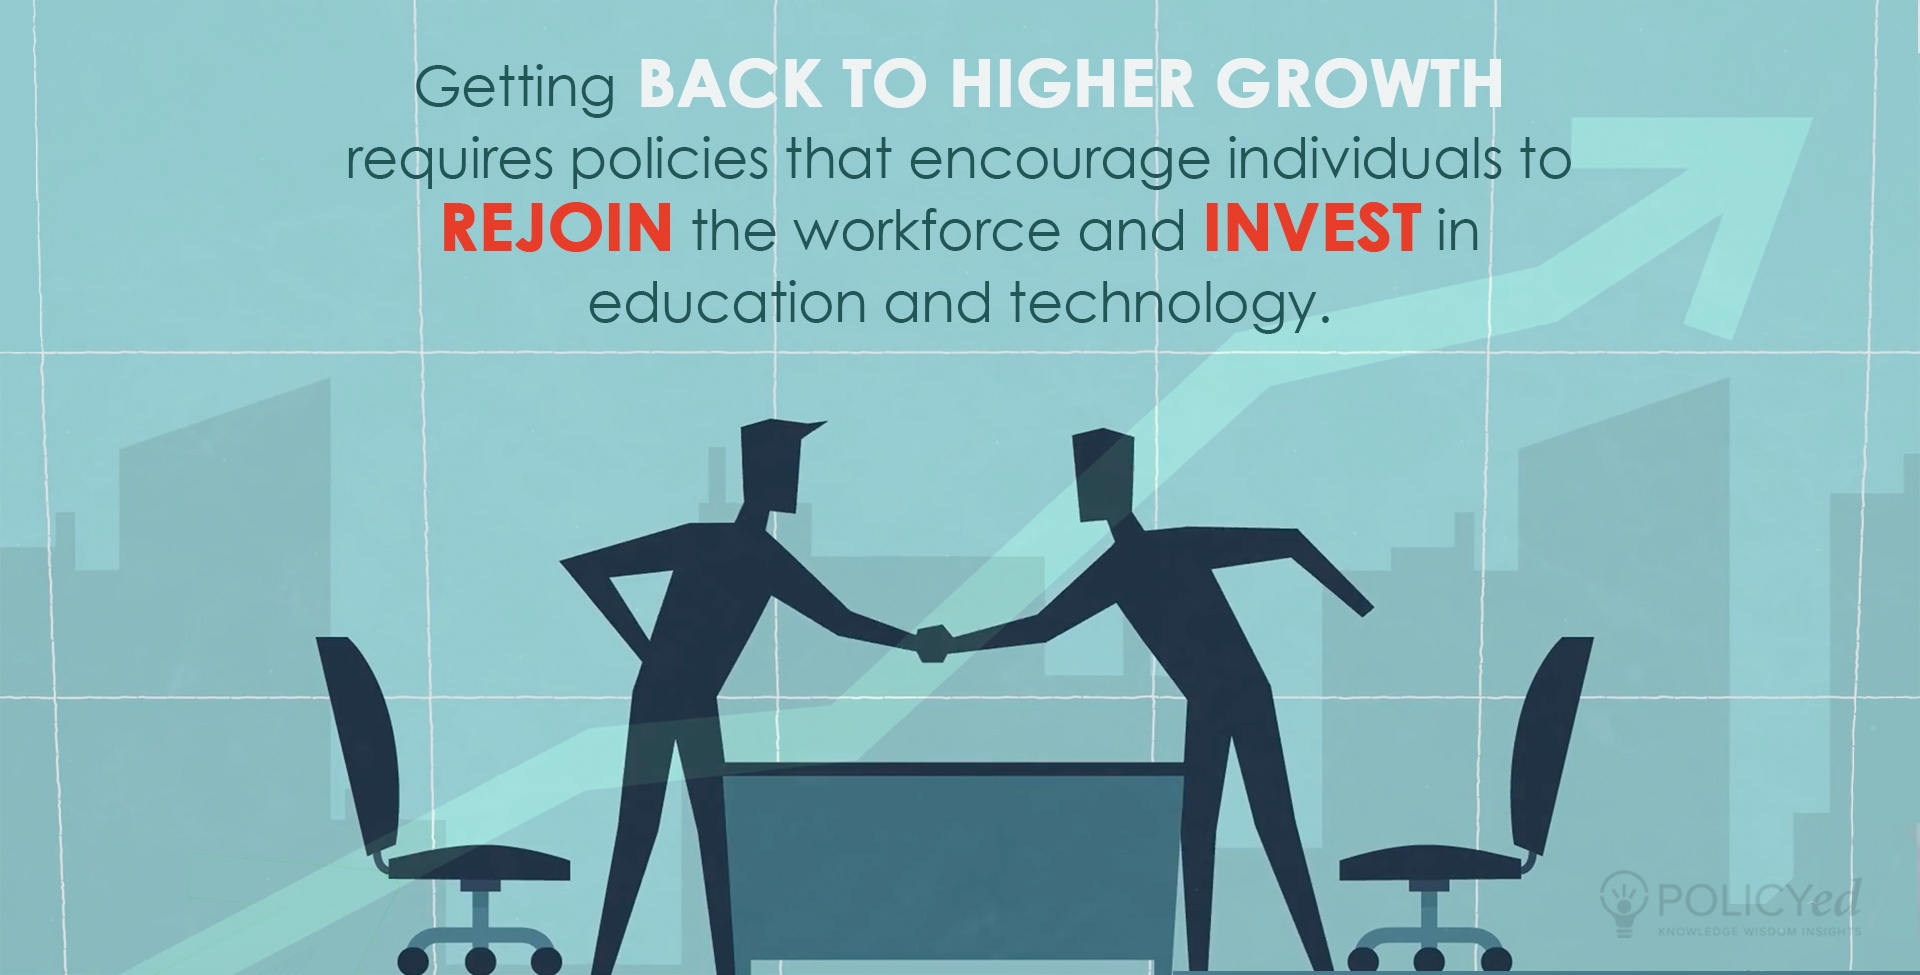
The next time you hear about policy ideas that are supposed to increase economic growth, ask yourself: On net, will this encourage more productivity? Will it lead to more people working? While there are second- and third-order effects to think through as well, those two questions are a good start to understanding if they are growth-friendly reforms.
What can we do in order to improve economic growth?
There is plenty we can do. As Cogan et al. wrote:
“Economic theory and historical experience indicate economic policies are the primary cause of both the productivity slowdown and the poorly performing labor market.”
Some people think that the slowdown in growth is inevitable. But many economists believe a major portion is due to policy. If that’s true it means we can improve growth, at least by an amount that makes a real difference in people’s lives.
Changes in productivity are how much more people can produce in the same amount of time. If you use a shovel to dig a hole, you’re a lot less productive than if you use a tractor.
Although it’s easier to picture physical things, technology in general makes us all more productive. Think about how much more we’re able to do with computers than we did before. Accountants used to have to balance ledgers on paper, and it took a lot of them to do so. Now one accountant with accounting software can do the job of many people in the past.
No one is advocating that we get rid of the forty-hour workweek. But the total hours worked in the economy are a function of how many hours people work plus how many people are working.
We measure how many people are working with the labor force participation rate, which has been falling since the late 1990s.
John Taylor has a short academic paper titled Can We Restart the Recovery all Over Again? that explains exactly this point. If nothing else, check out the two graphs at the end of the paper. You can find them in PDF form here.
How to know if a policy will contribute to economic growth.
It is important to consider the effects each public policy will have on economic growth. Sacrificing growth in the name of helping others may not be the wisest move. After all, long-term growth raises income and consumption, as well as available technology, goods, and services.
It is important to keep in mind that every decision about regulation, taxes, and government spending affects decisions to work, invest, or innovate. Although there are benefits to every policy, there are always costs as well that are often undervalued out of political expediency.
Economic growth is a good thing. The combination of increases to productivity and total hours worked is what leads to economic growth. Interpreting policy proposals based on how they affect either of those things is an easy way to determine their overall effect on growth.